Historical figures and earlier comparison profiles. Scope and dates vary by figure.
All static map layers and illustrative GeoAI sequences in one place. Open an image at full size or download its PNG for a document or presentation. Each figure includes its interpretation and limitations.
Public explorer · default everyday walks
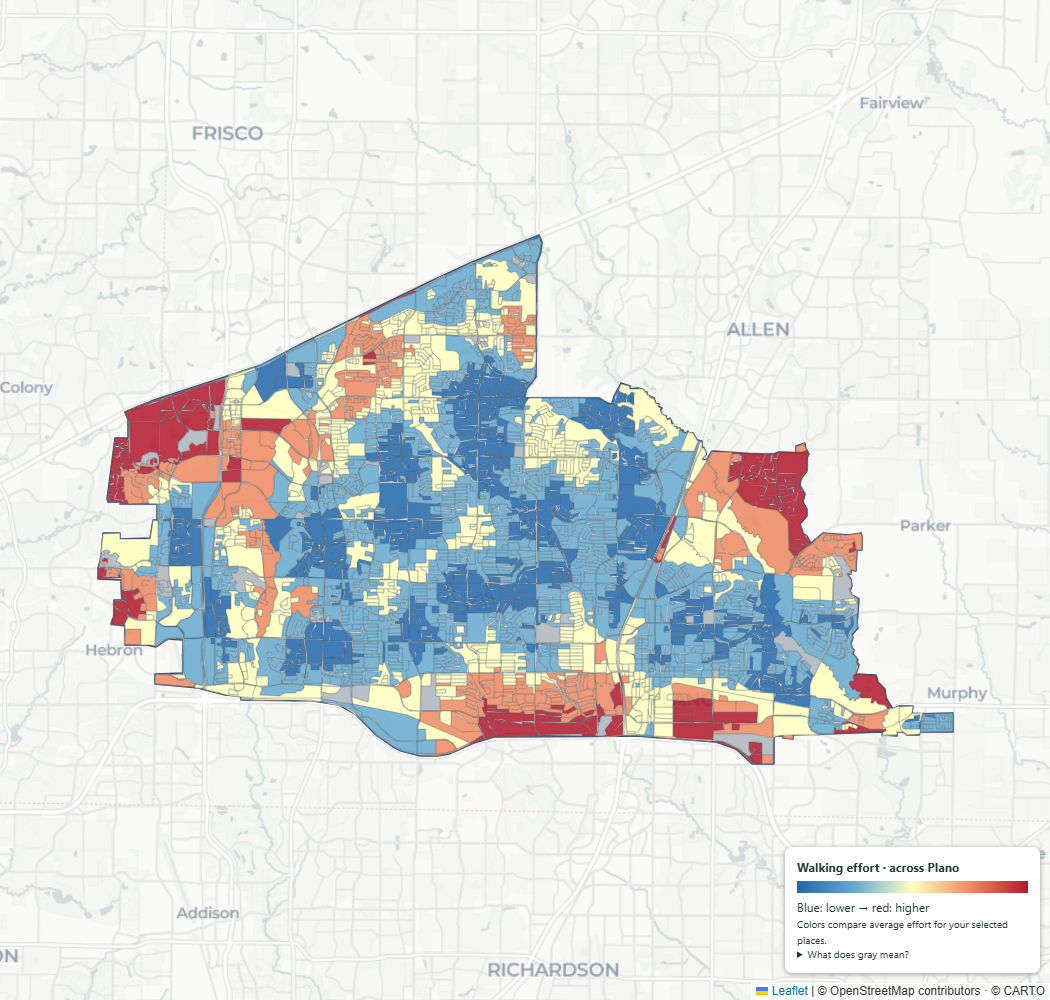
Public explorer · everyday walks within a 20-minute effort budget
Each selected destination must be within a 20-effort-minute budget. 2020 residential areas passing an automatic connection-distance filter. Blue = lower average modeled effort; red = higher among matches. Gray = not a match or needs review; not a safety rating. Routes use a fully weighted 3 km context beyond Plano; extent sufficiency checked for short walks. Entrances remain unverified. Sources: OpenStreetMap contributors; City of Plano; Census Bureau; TxDOT; USDA NAIP; USGS Landsat.Download PNG
Plano city · current analysis
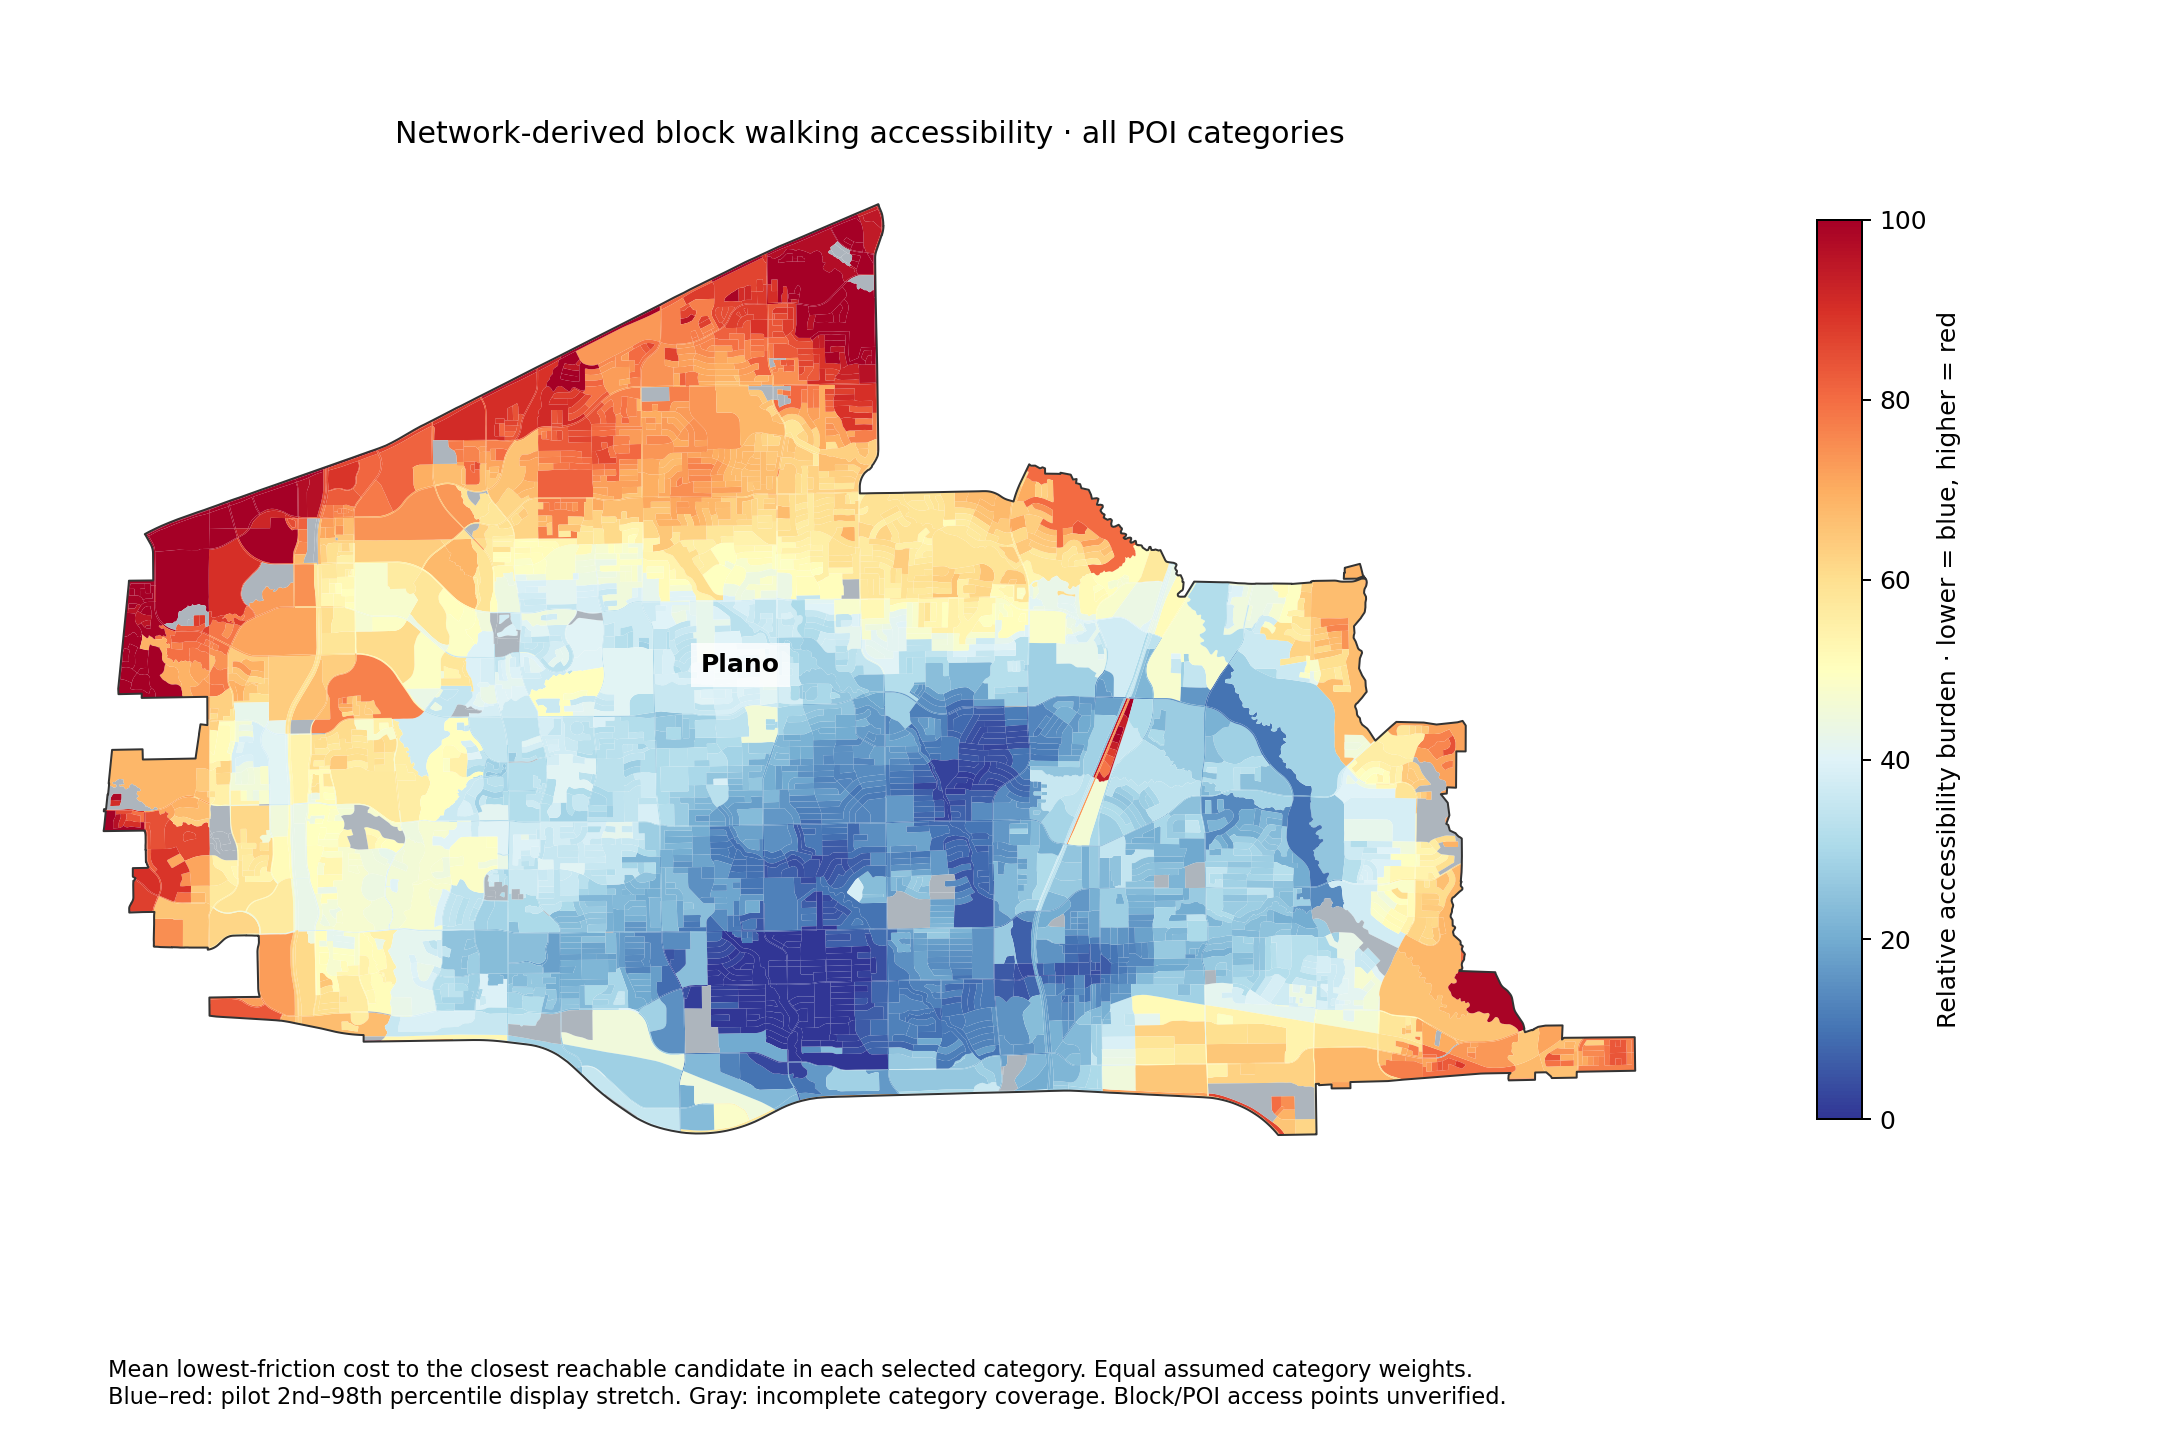
Plano city accessibility — nearest POI per category
Average minimum weighted trip cost to one candidate in each service category. Equal category weights. Blue lower, red higher. Gray incomplete; block entrances unverified.Download PNG
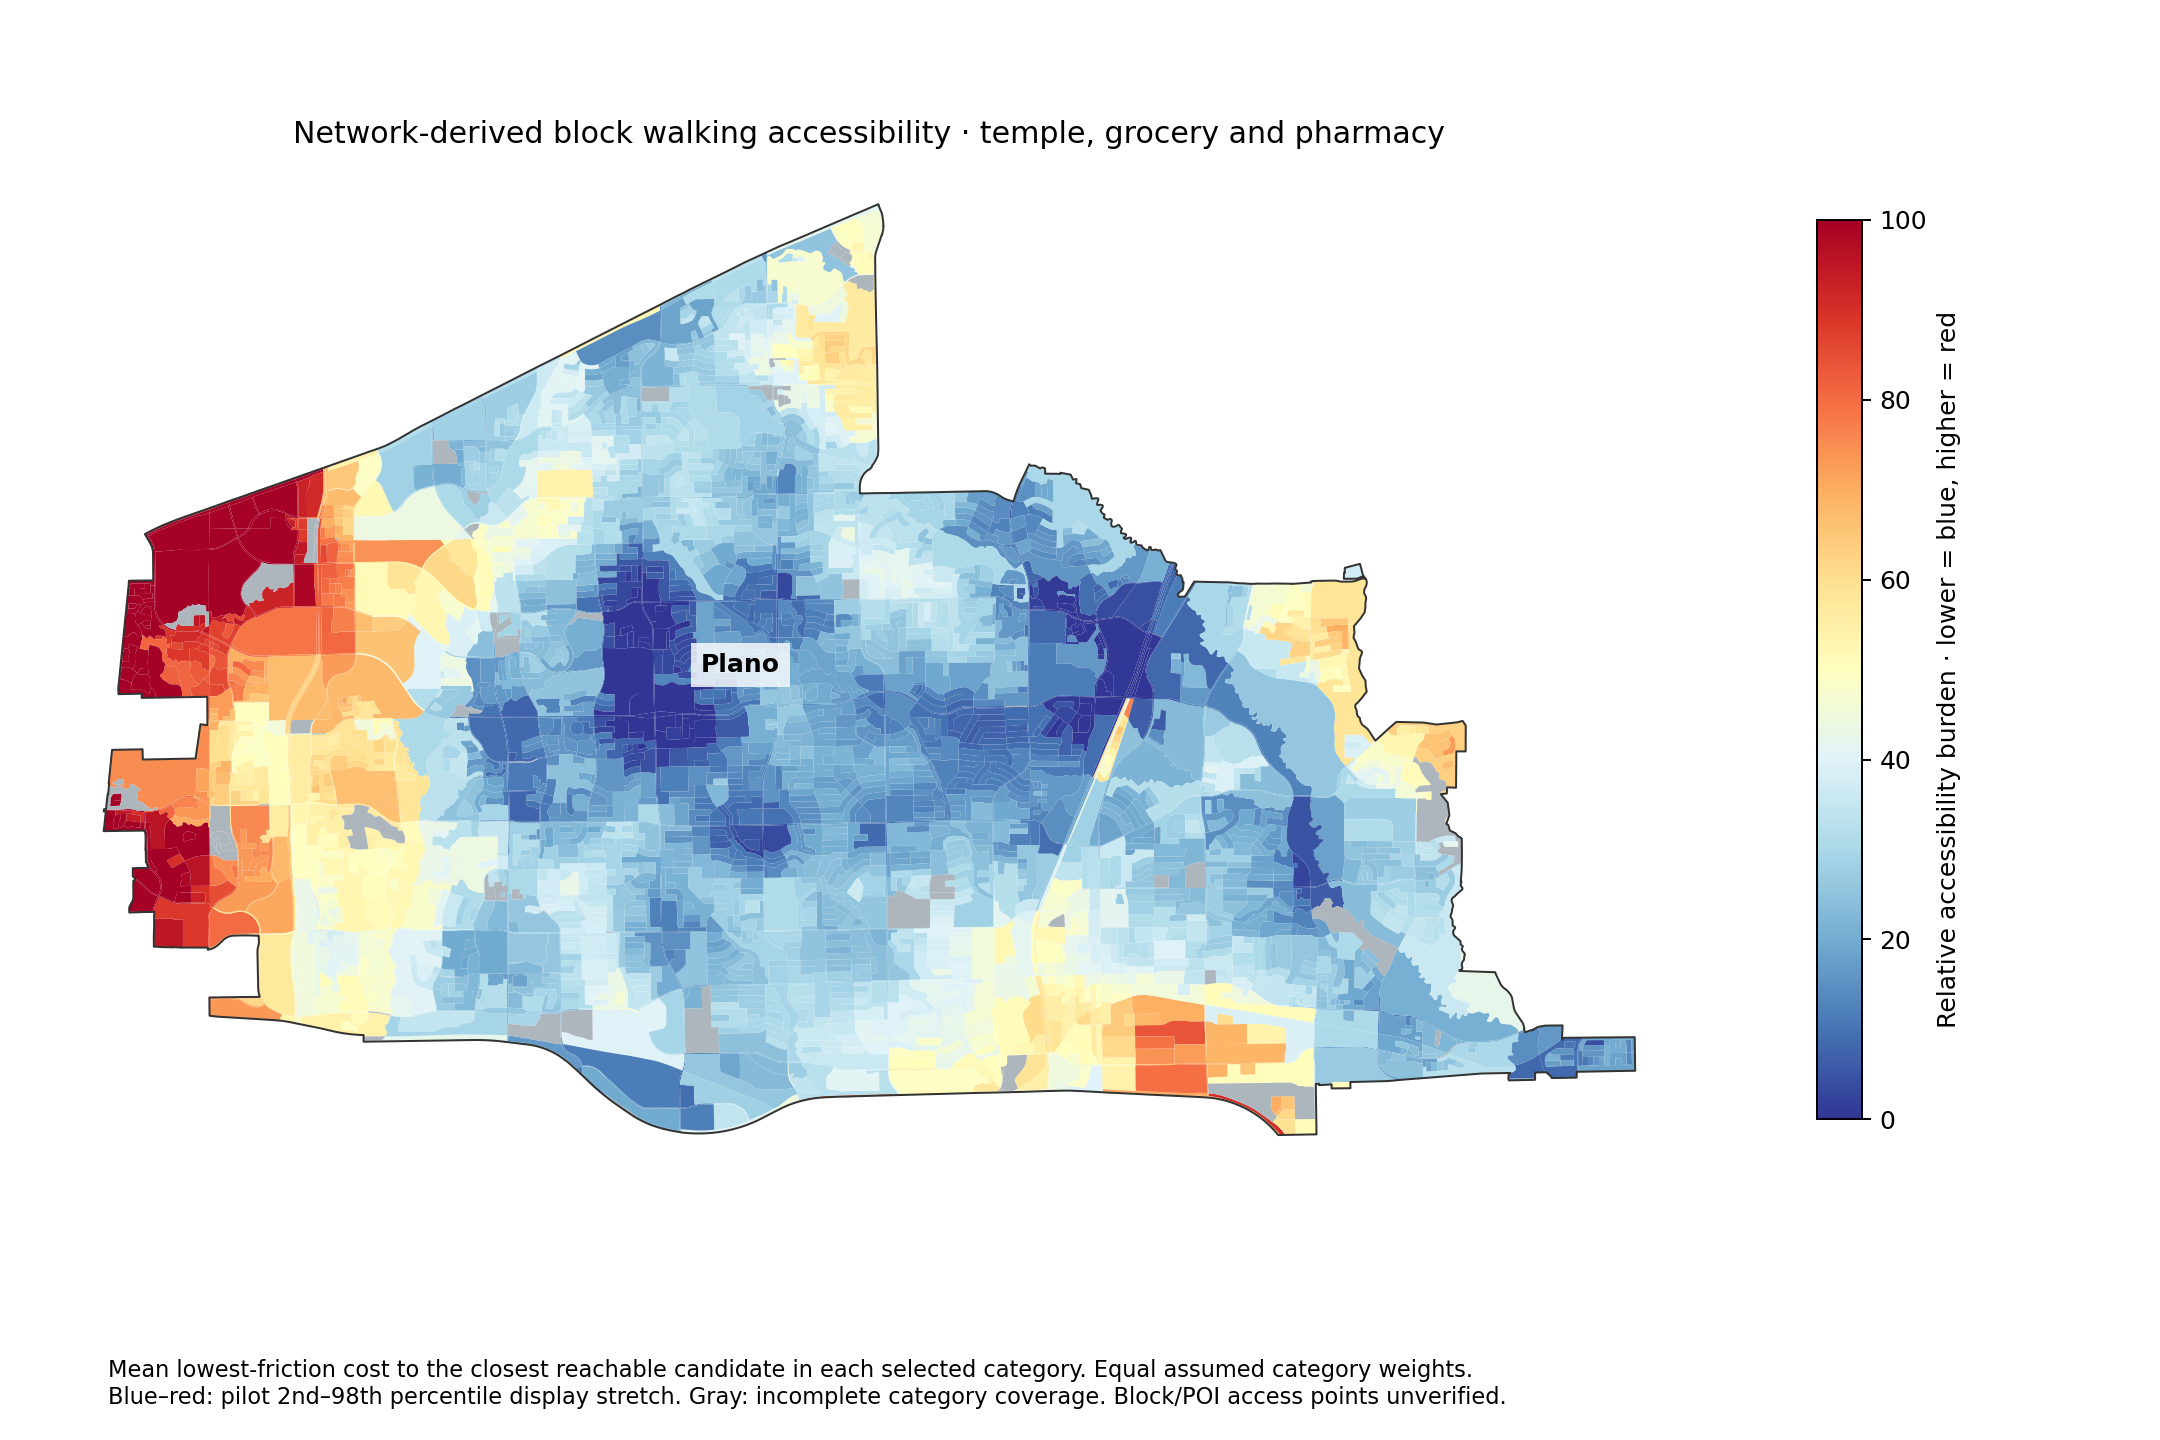
Plano city accessibility — temple, grocery and pharmacy
Average lowest-friction trip to a Hindu temple candidate, supermarket and pharmacy. Candidate catalog is incomplete; housing/entrance suitability unverified.Download PNG
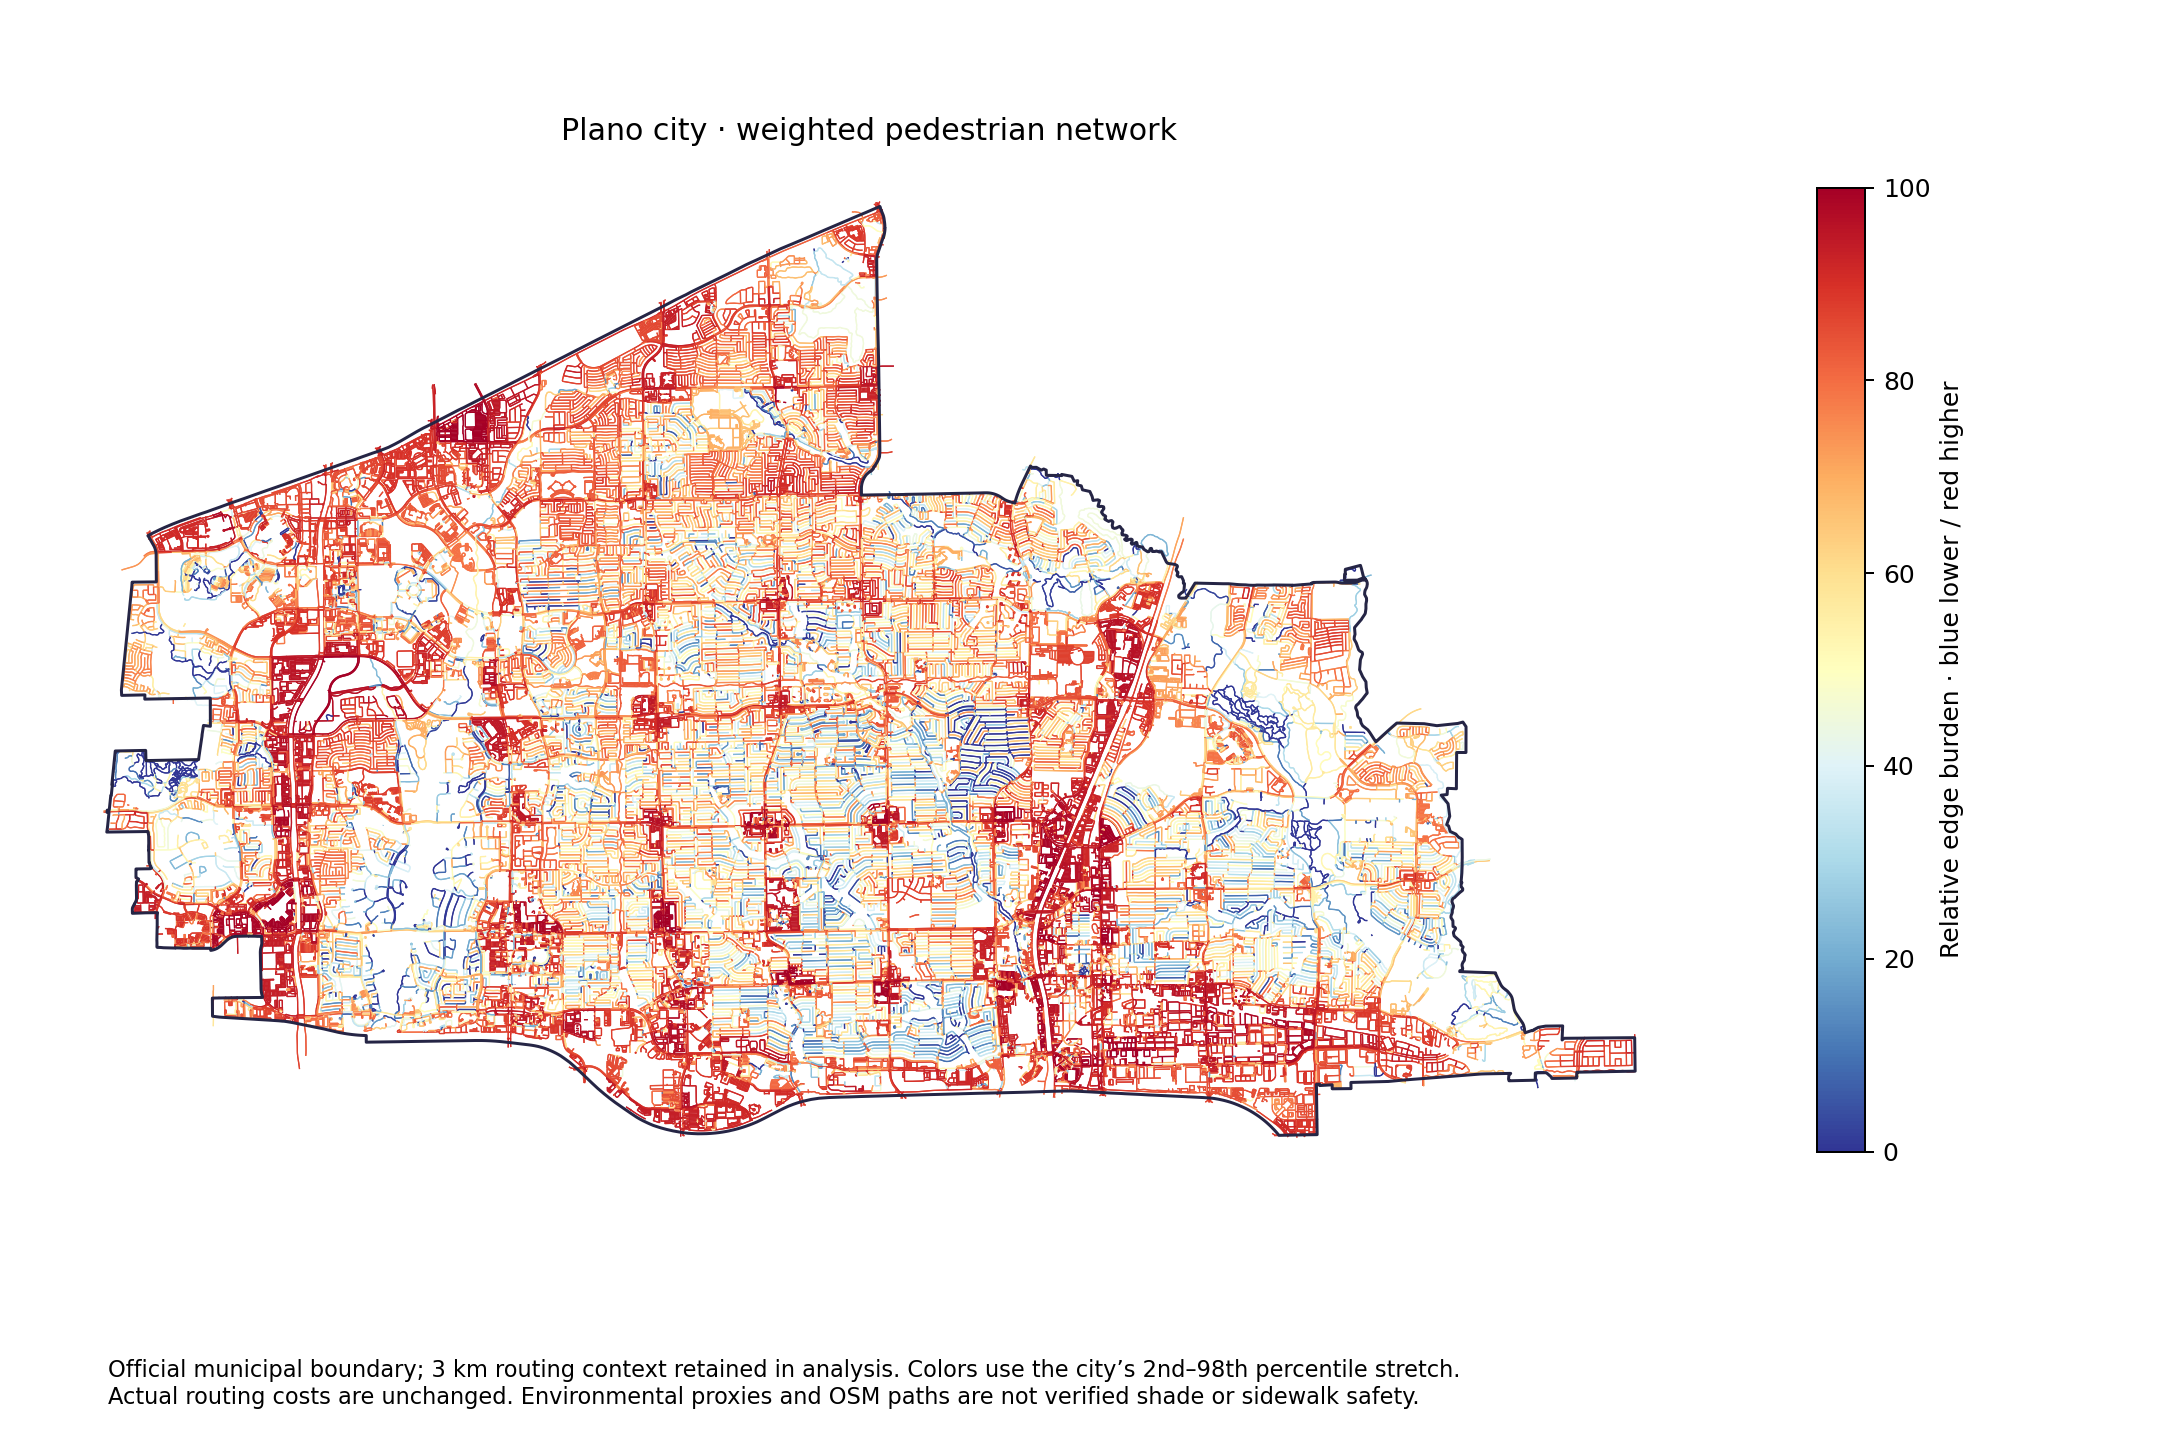
Plano city weighted walking network
Actual OSM walking network with block-context friction weights. Blue/red colors stretch city 2nd–98th percentiles; actual route weights are unchanged. A 3 km routing buffer is included.Download PNG
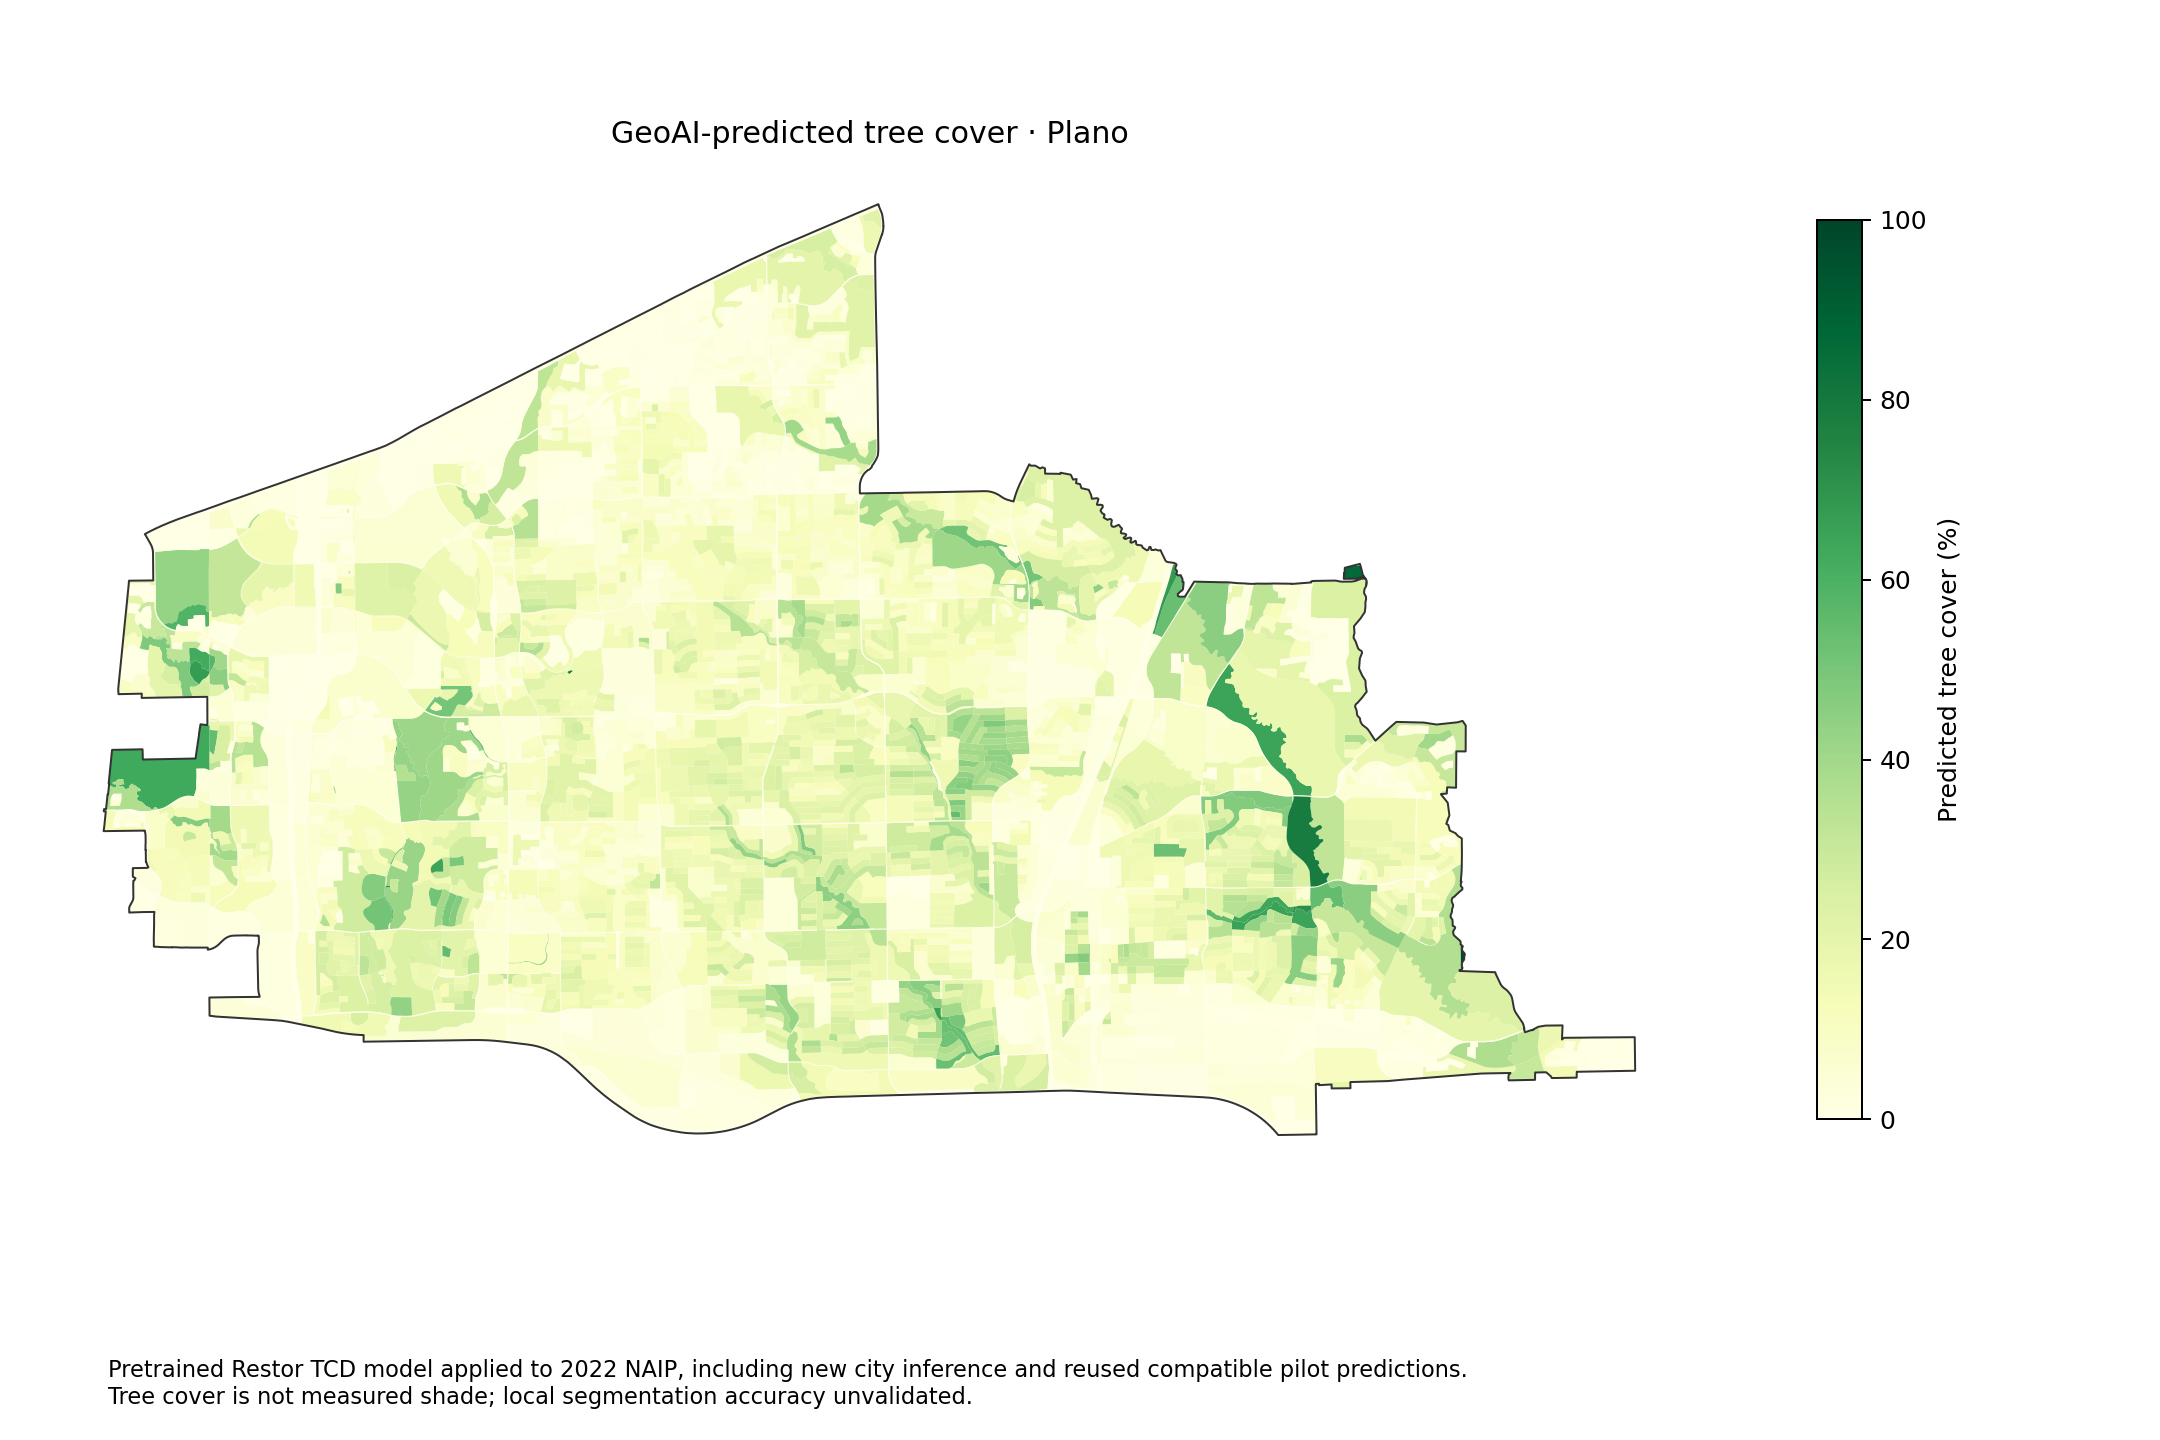
GeoAI-predicted tree cover · Plano
Pretrained Restor TCD model applied to 2022 NAIP, including new city inference and reused compatible pilot predictions. Tree cover is not measured shade; local segmentation accuracy unvalidated.Download PNG
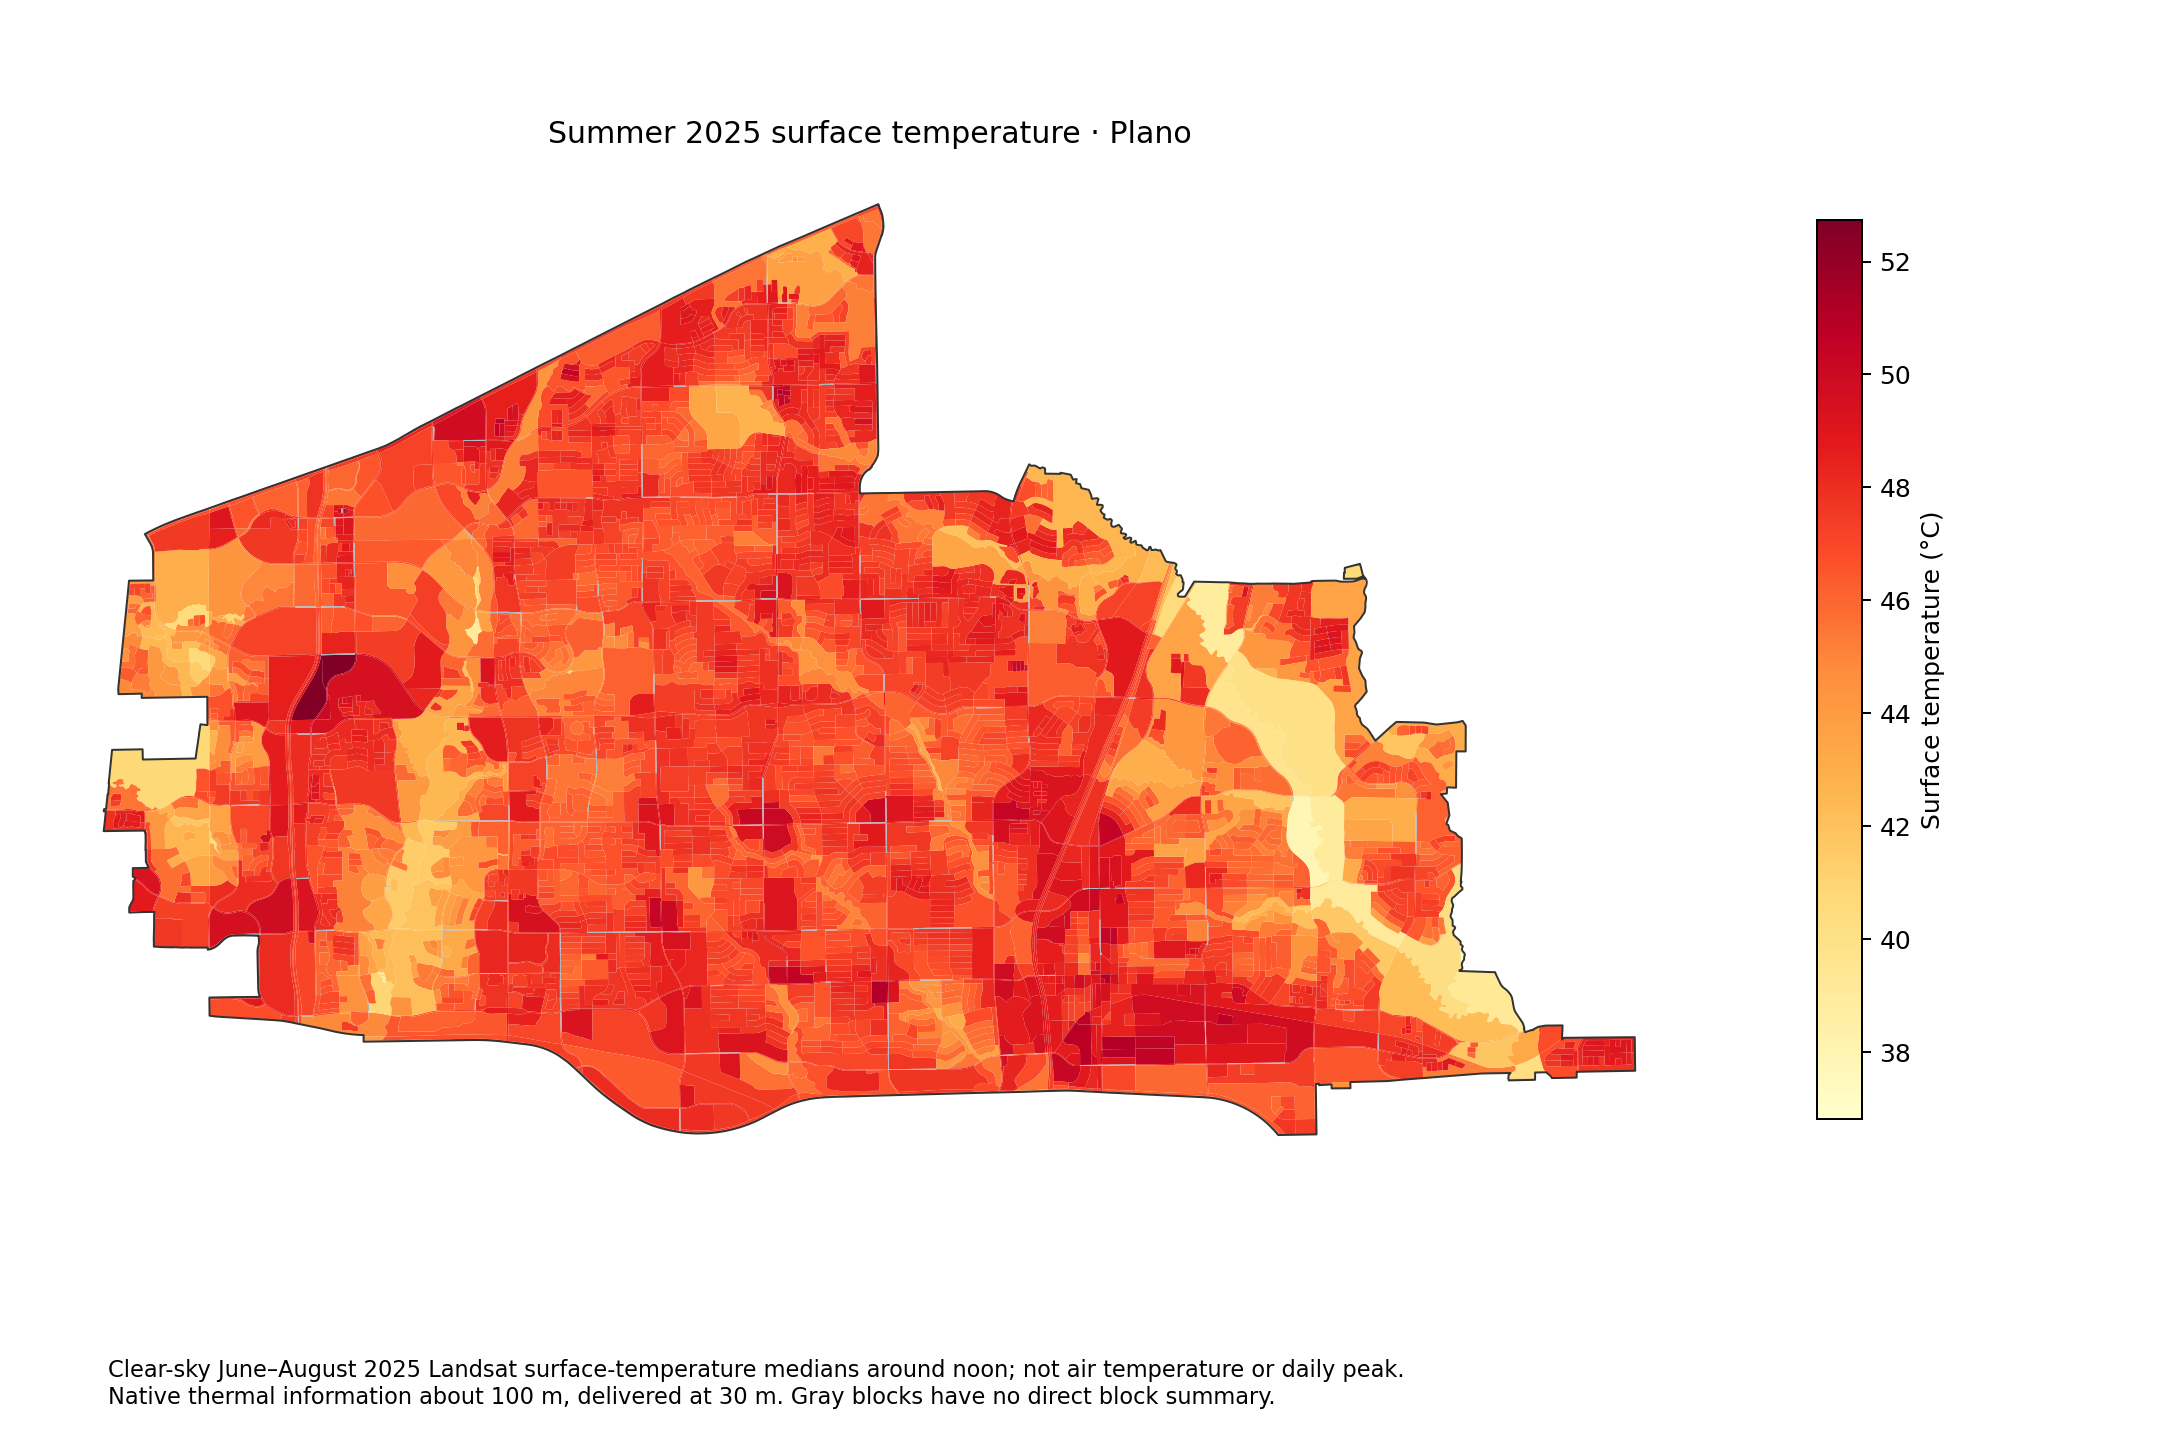
Summer 2025 surface temperature · Plano
Clear-sky June–August 2025 Landsat surface-temperature medians around noon; not air temperature or daily peak. Native thermal information about 100 m, delivered at 30 m. Gray blocks have no direct block summary.Download PNG
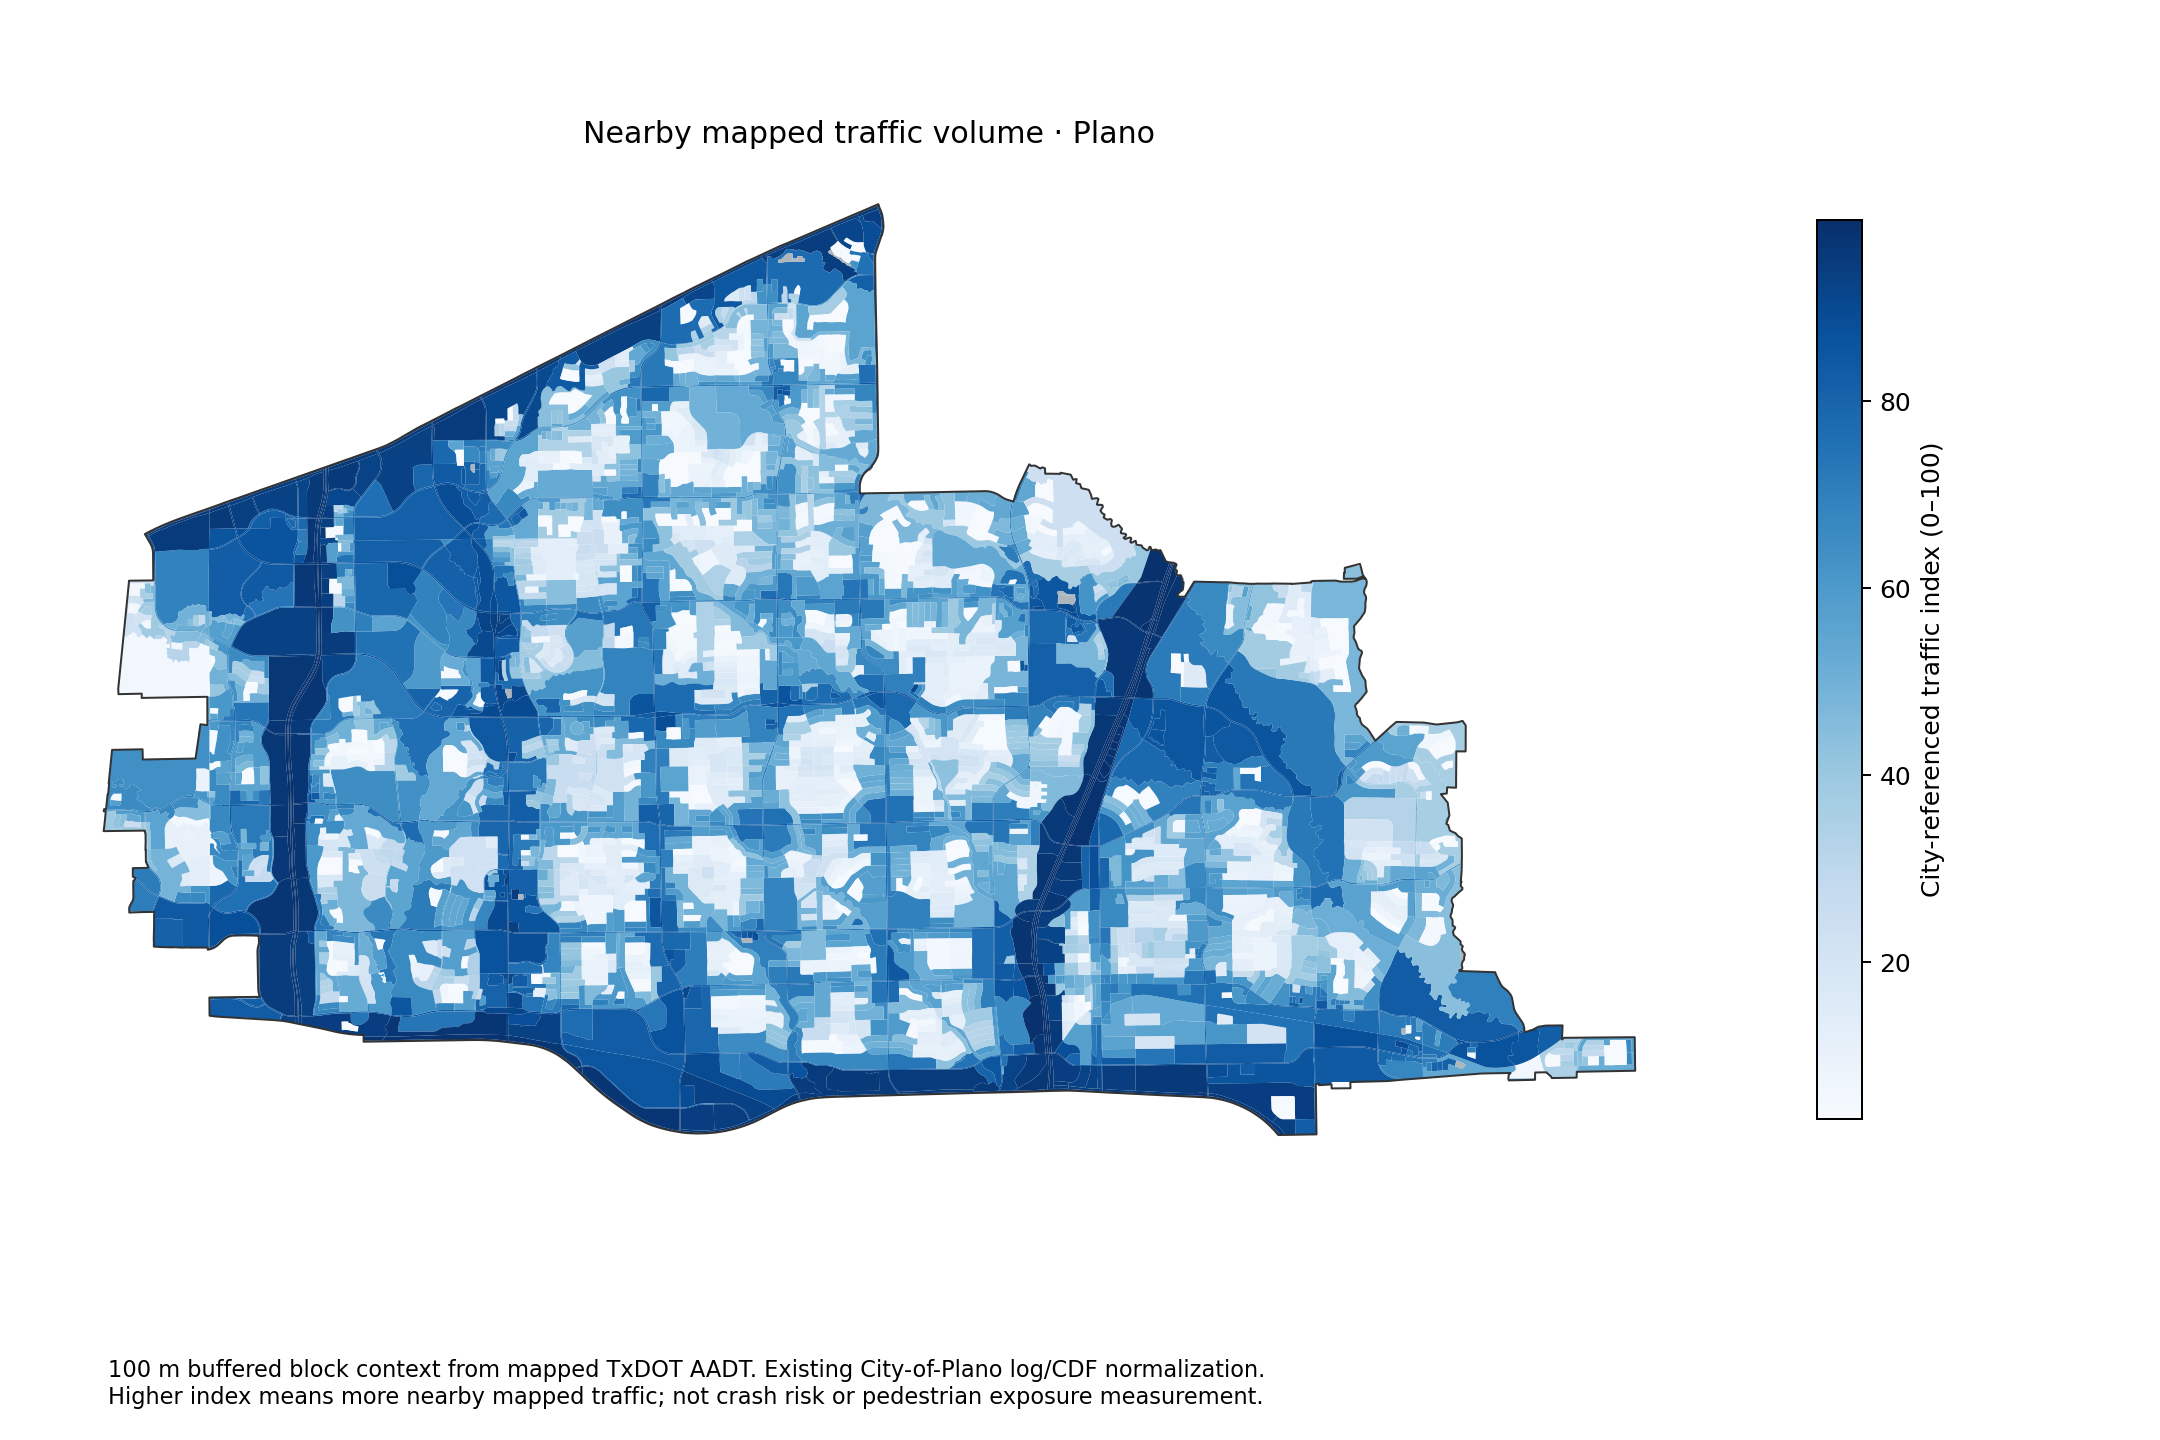
Nearby mapped traffic volume · Plano
100 m buffered block context from mapped TxDOT AADT. Existing City-of-Plano log/CDF normalization. Higher index means more nearby mapped traffic; not crash risk or pedestrian exposure measurement.Download PNG
Plano city · population, affordability and demographics
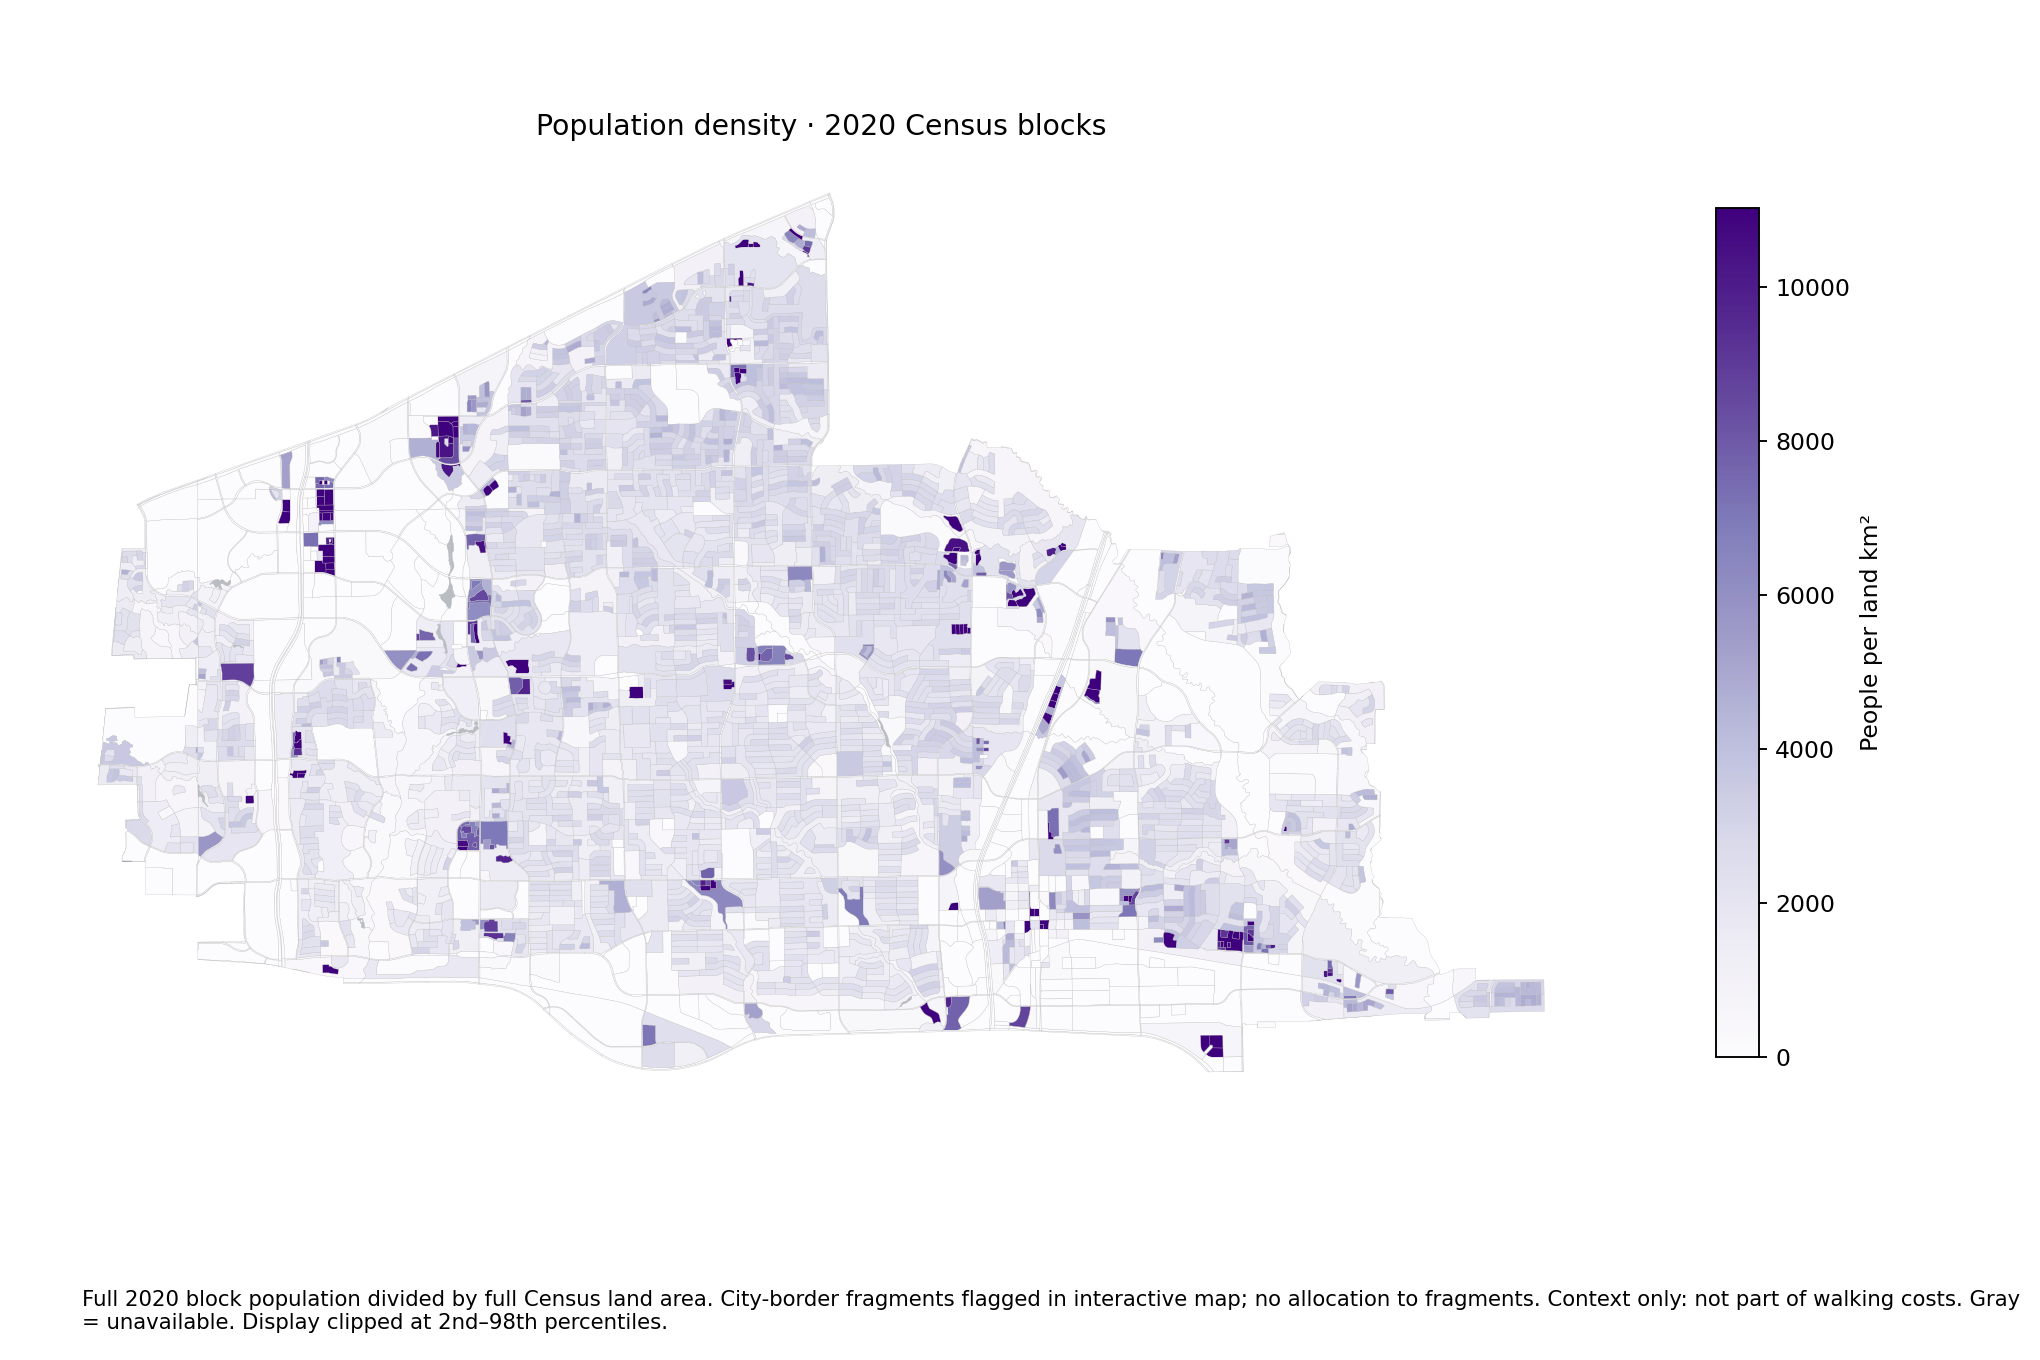
Population density · 2020 Census blocks
Full 2020 block population divided by full Census land area. City-border fragments flagged in interactive map; no allocation to fragments. Context only: not part of walking costs. Gray = unavailable. Display clipped at 2nd–98th percentiles.Download PNG
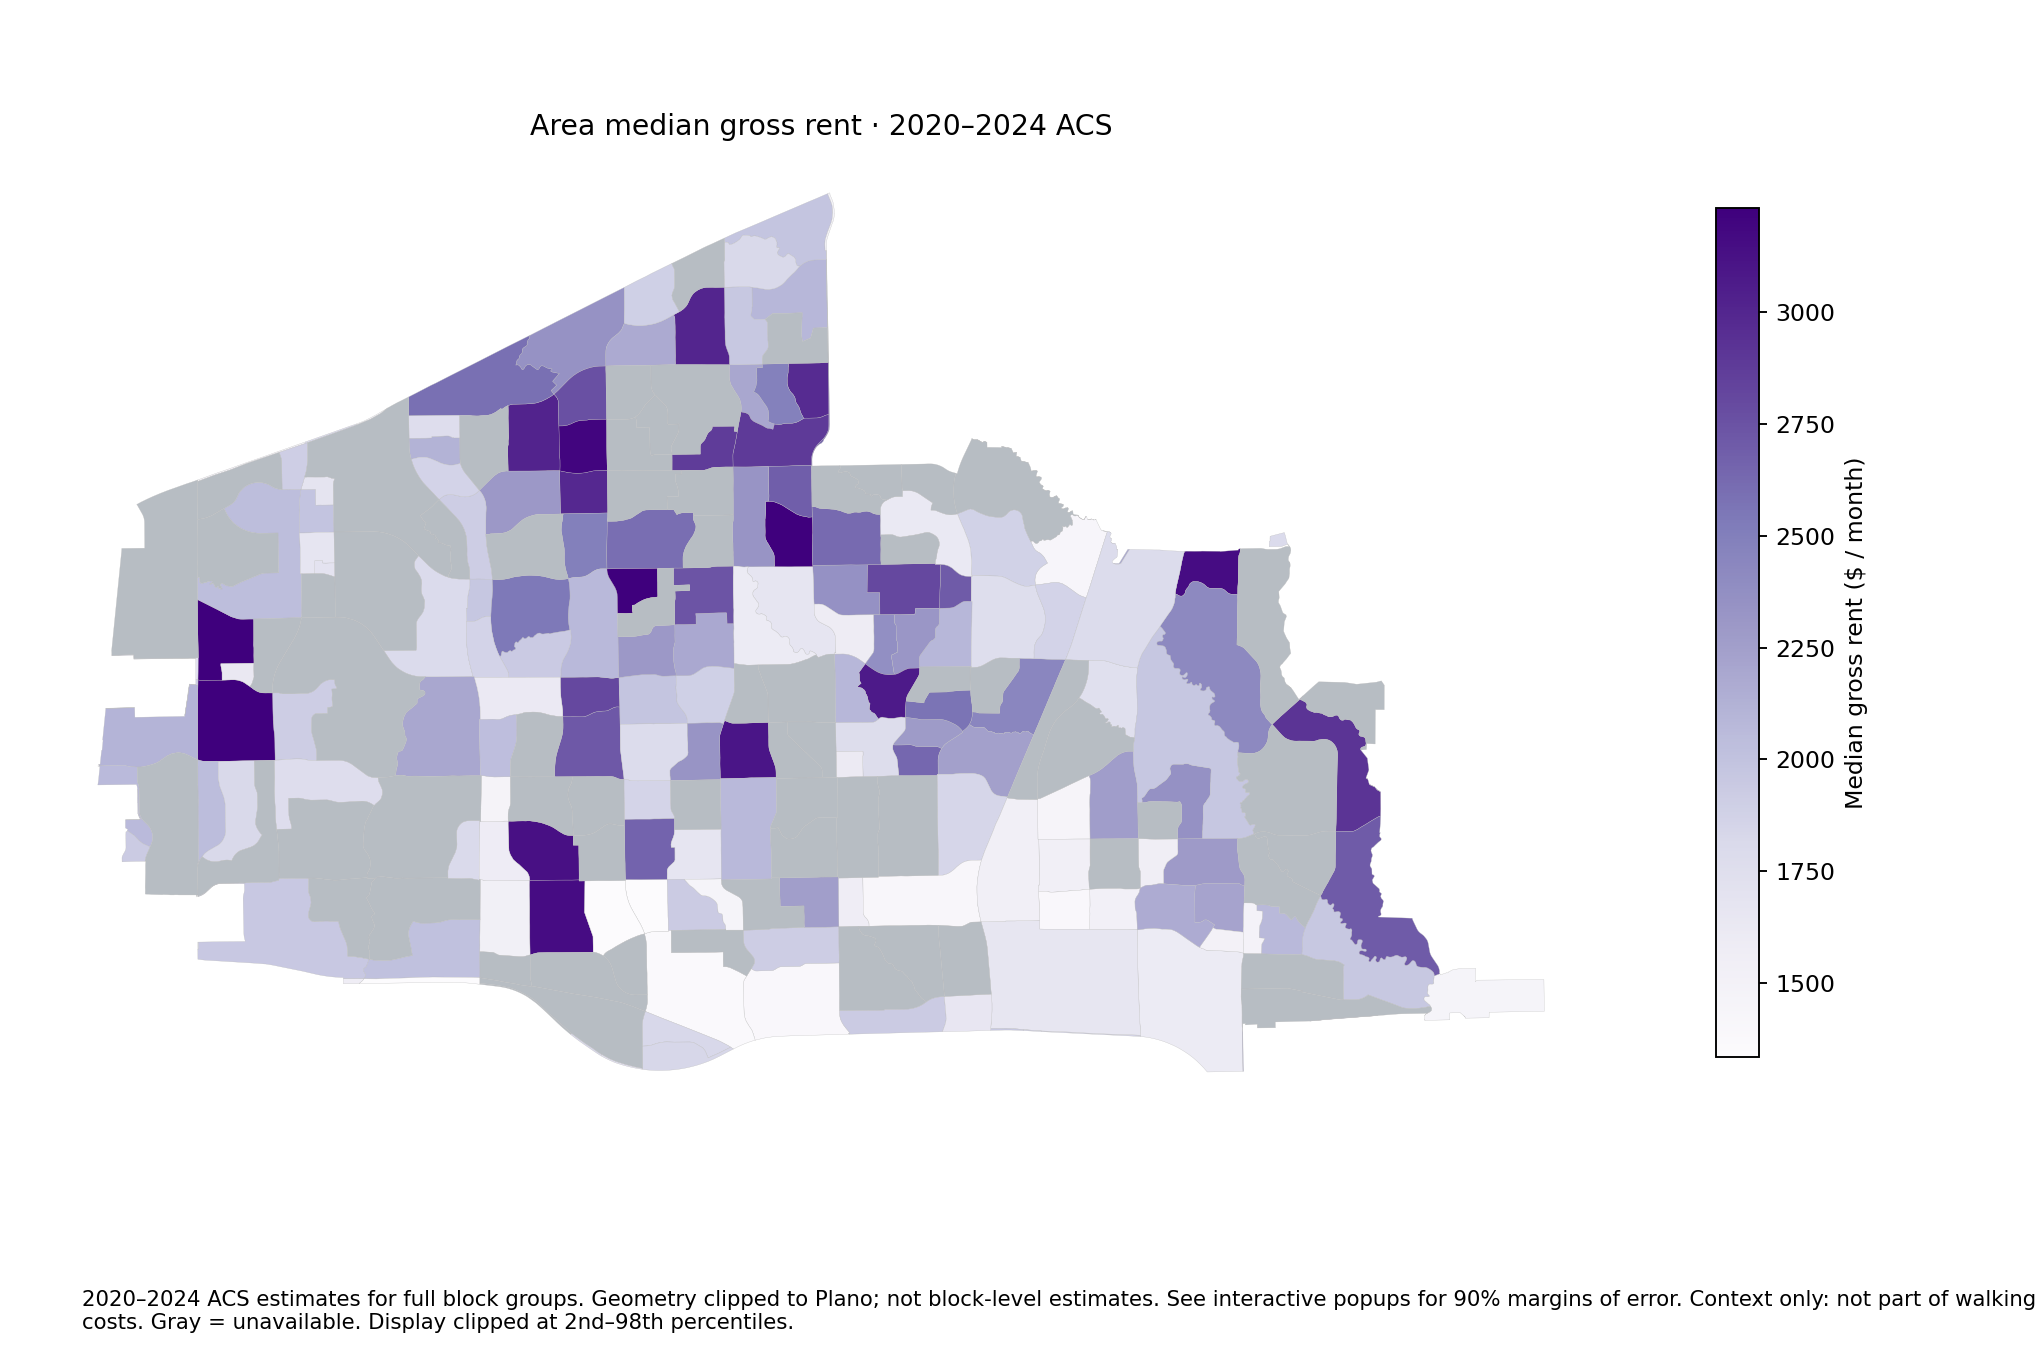
Area median gross rent · 2020–2024 ACS
2020–2024 ACS estimates for full block groups. Geometry clipped to Plano; not block-level estimates. See interactive popups for 90% margins of error. Context only: not part of walking costs. Gray = unavailable. Display clipped at 2nd–98th percentiles.Download PNG
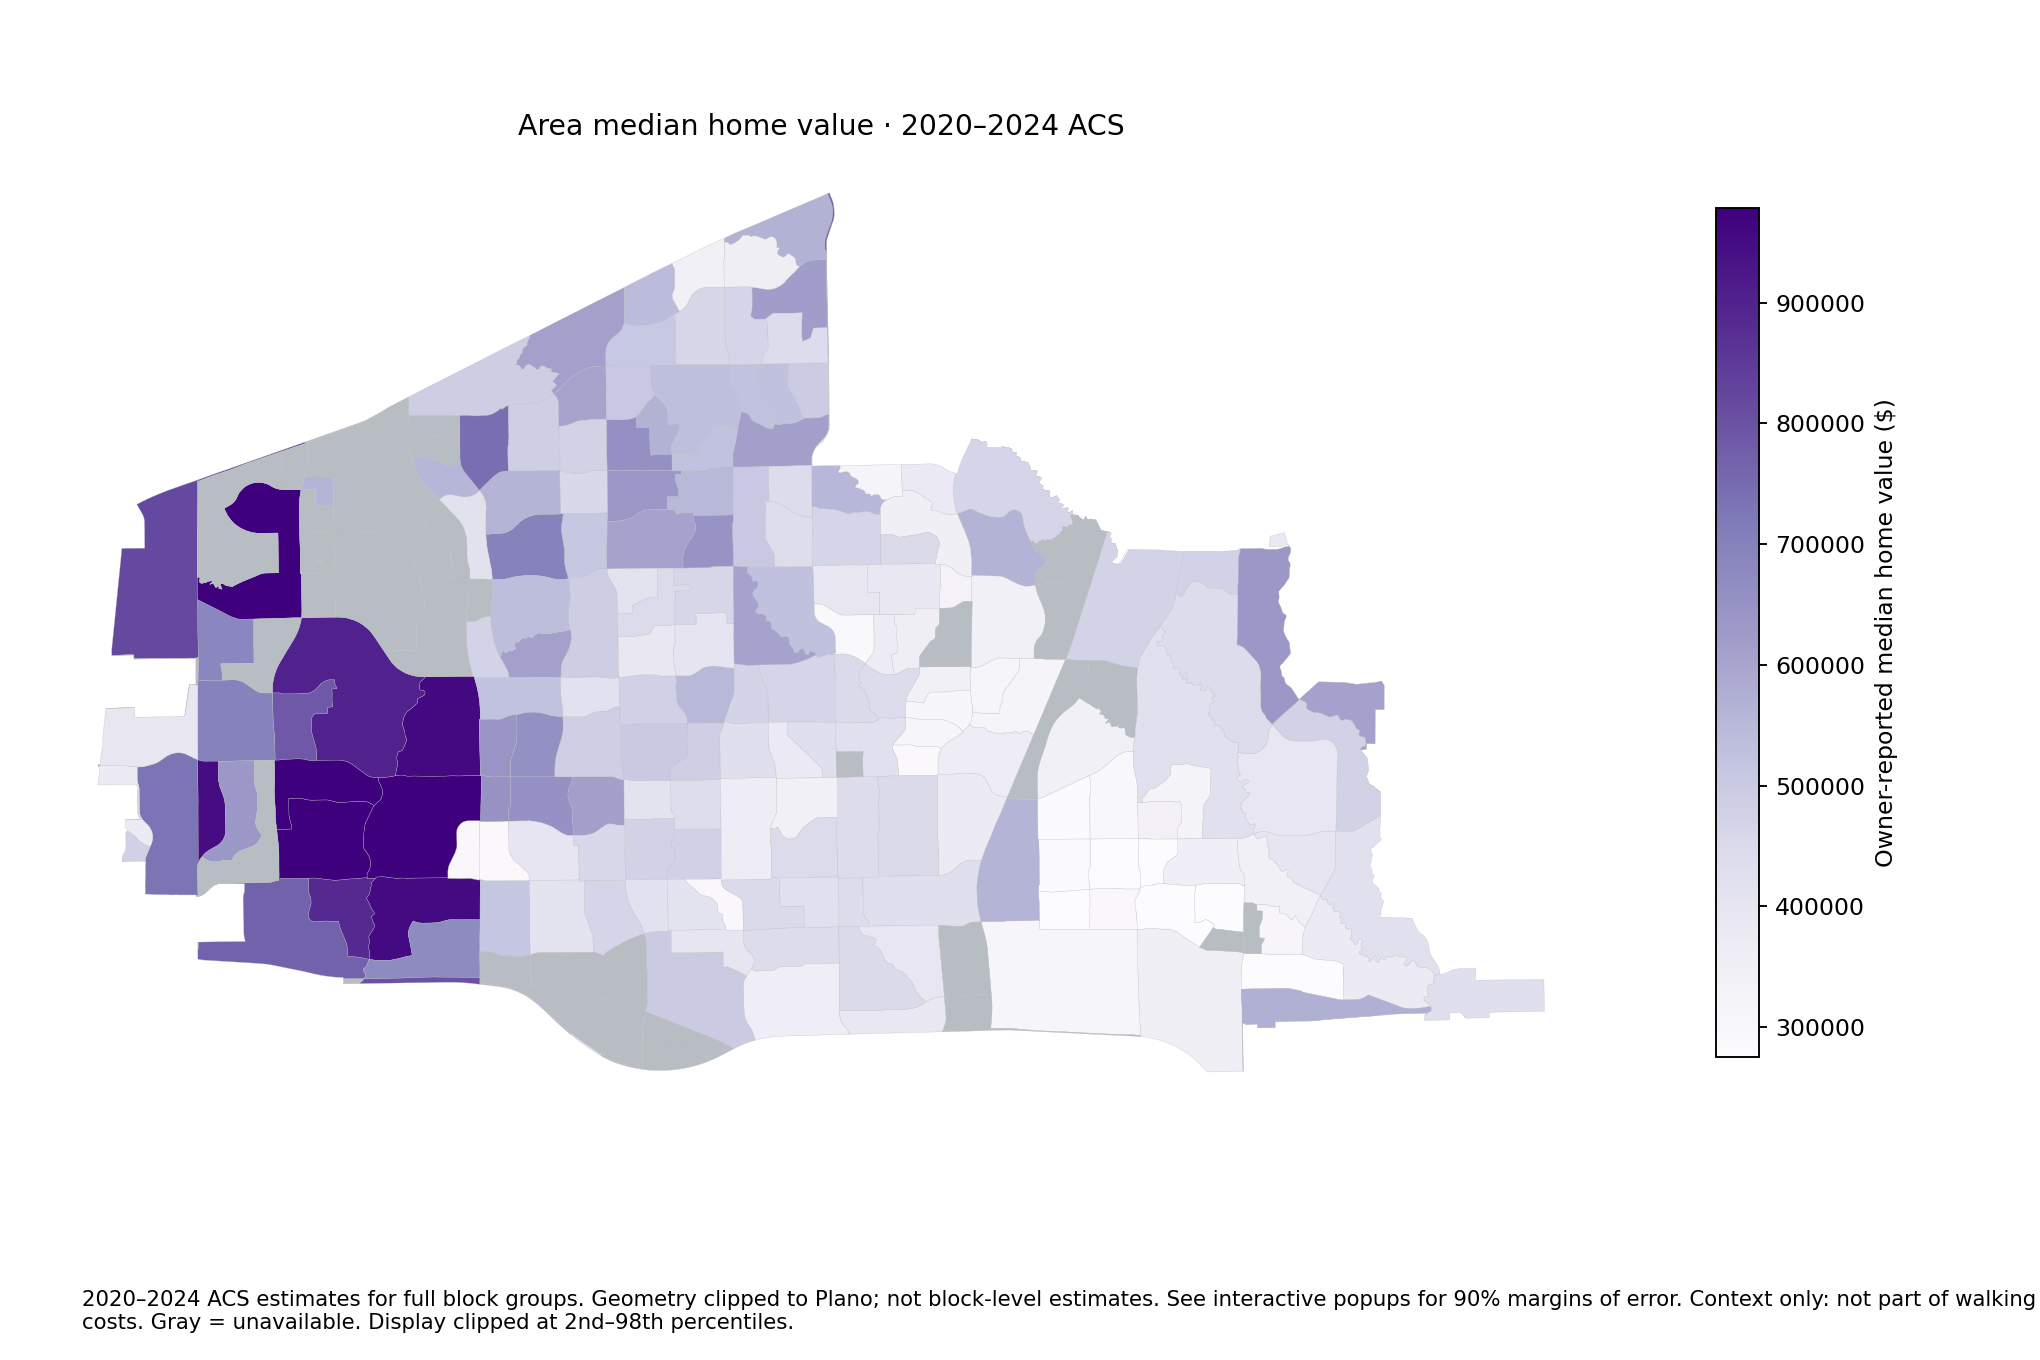
Area median home value · 2020–2024 ACS
2020–2024 ACS estimates for full block groups. Geometry clipped to Plano; not block-level estimates. See interactive popups for 90% margins of error. Context only: not part of walking costs. Gray = unavailable. Display clipped at 2nd–98th percentiles.Download PNG
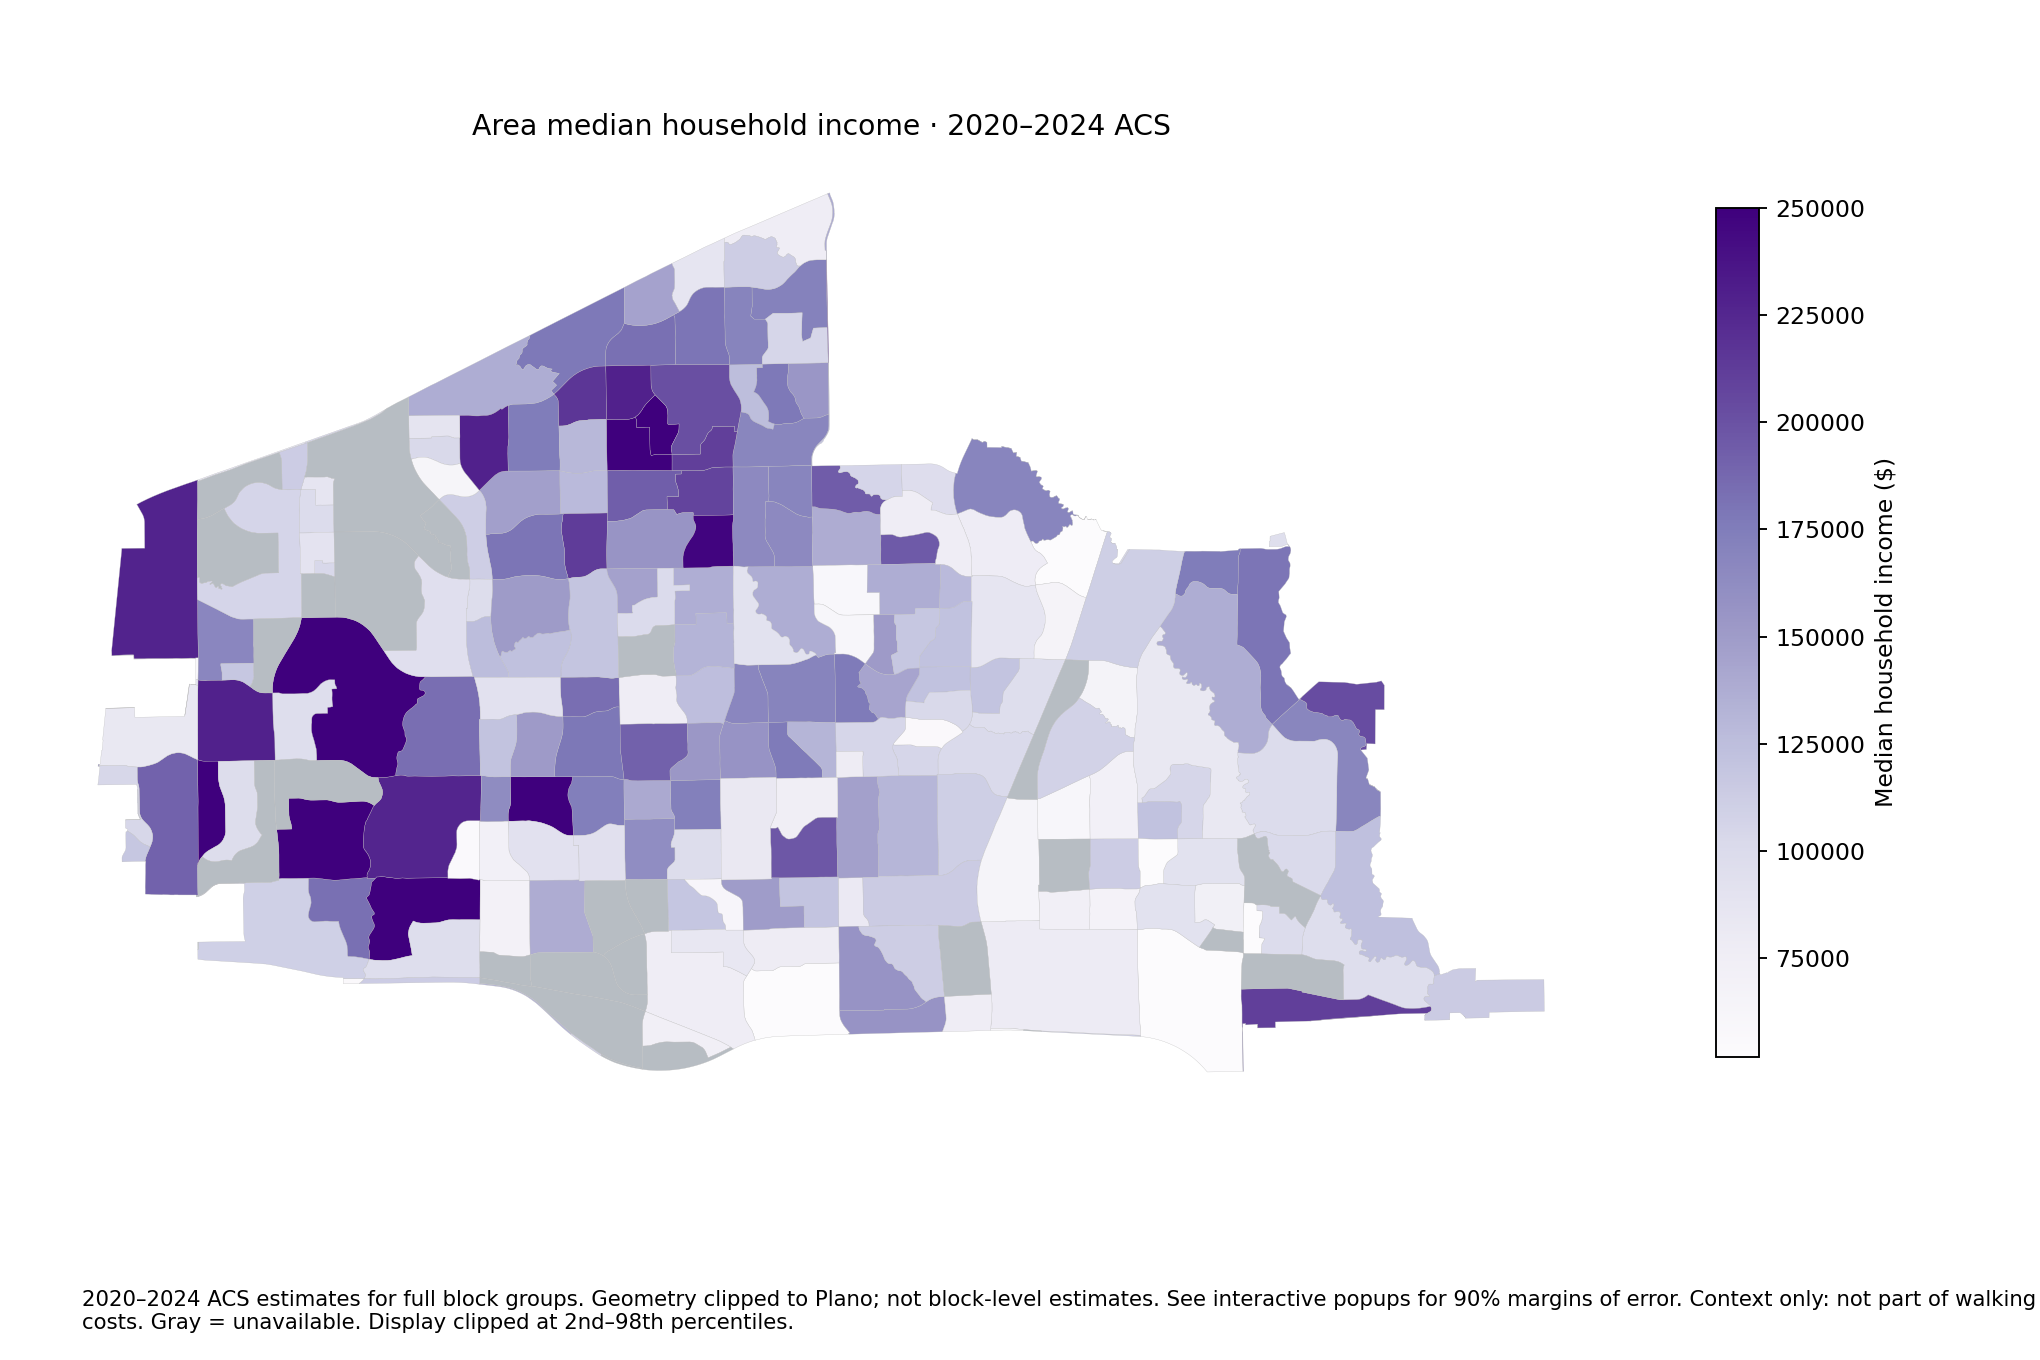
Area median household income · 2020–2024 ACS
2020–2024 ACS estimates for full block groups. Geometry clipped to Plano; not block-level estimates. See interactive popups for 90% margins of error. Context only: not part of walking costs. Gray = unavailable. Display clipped at 2nd–98th percentiles.Download PNG
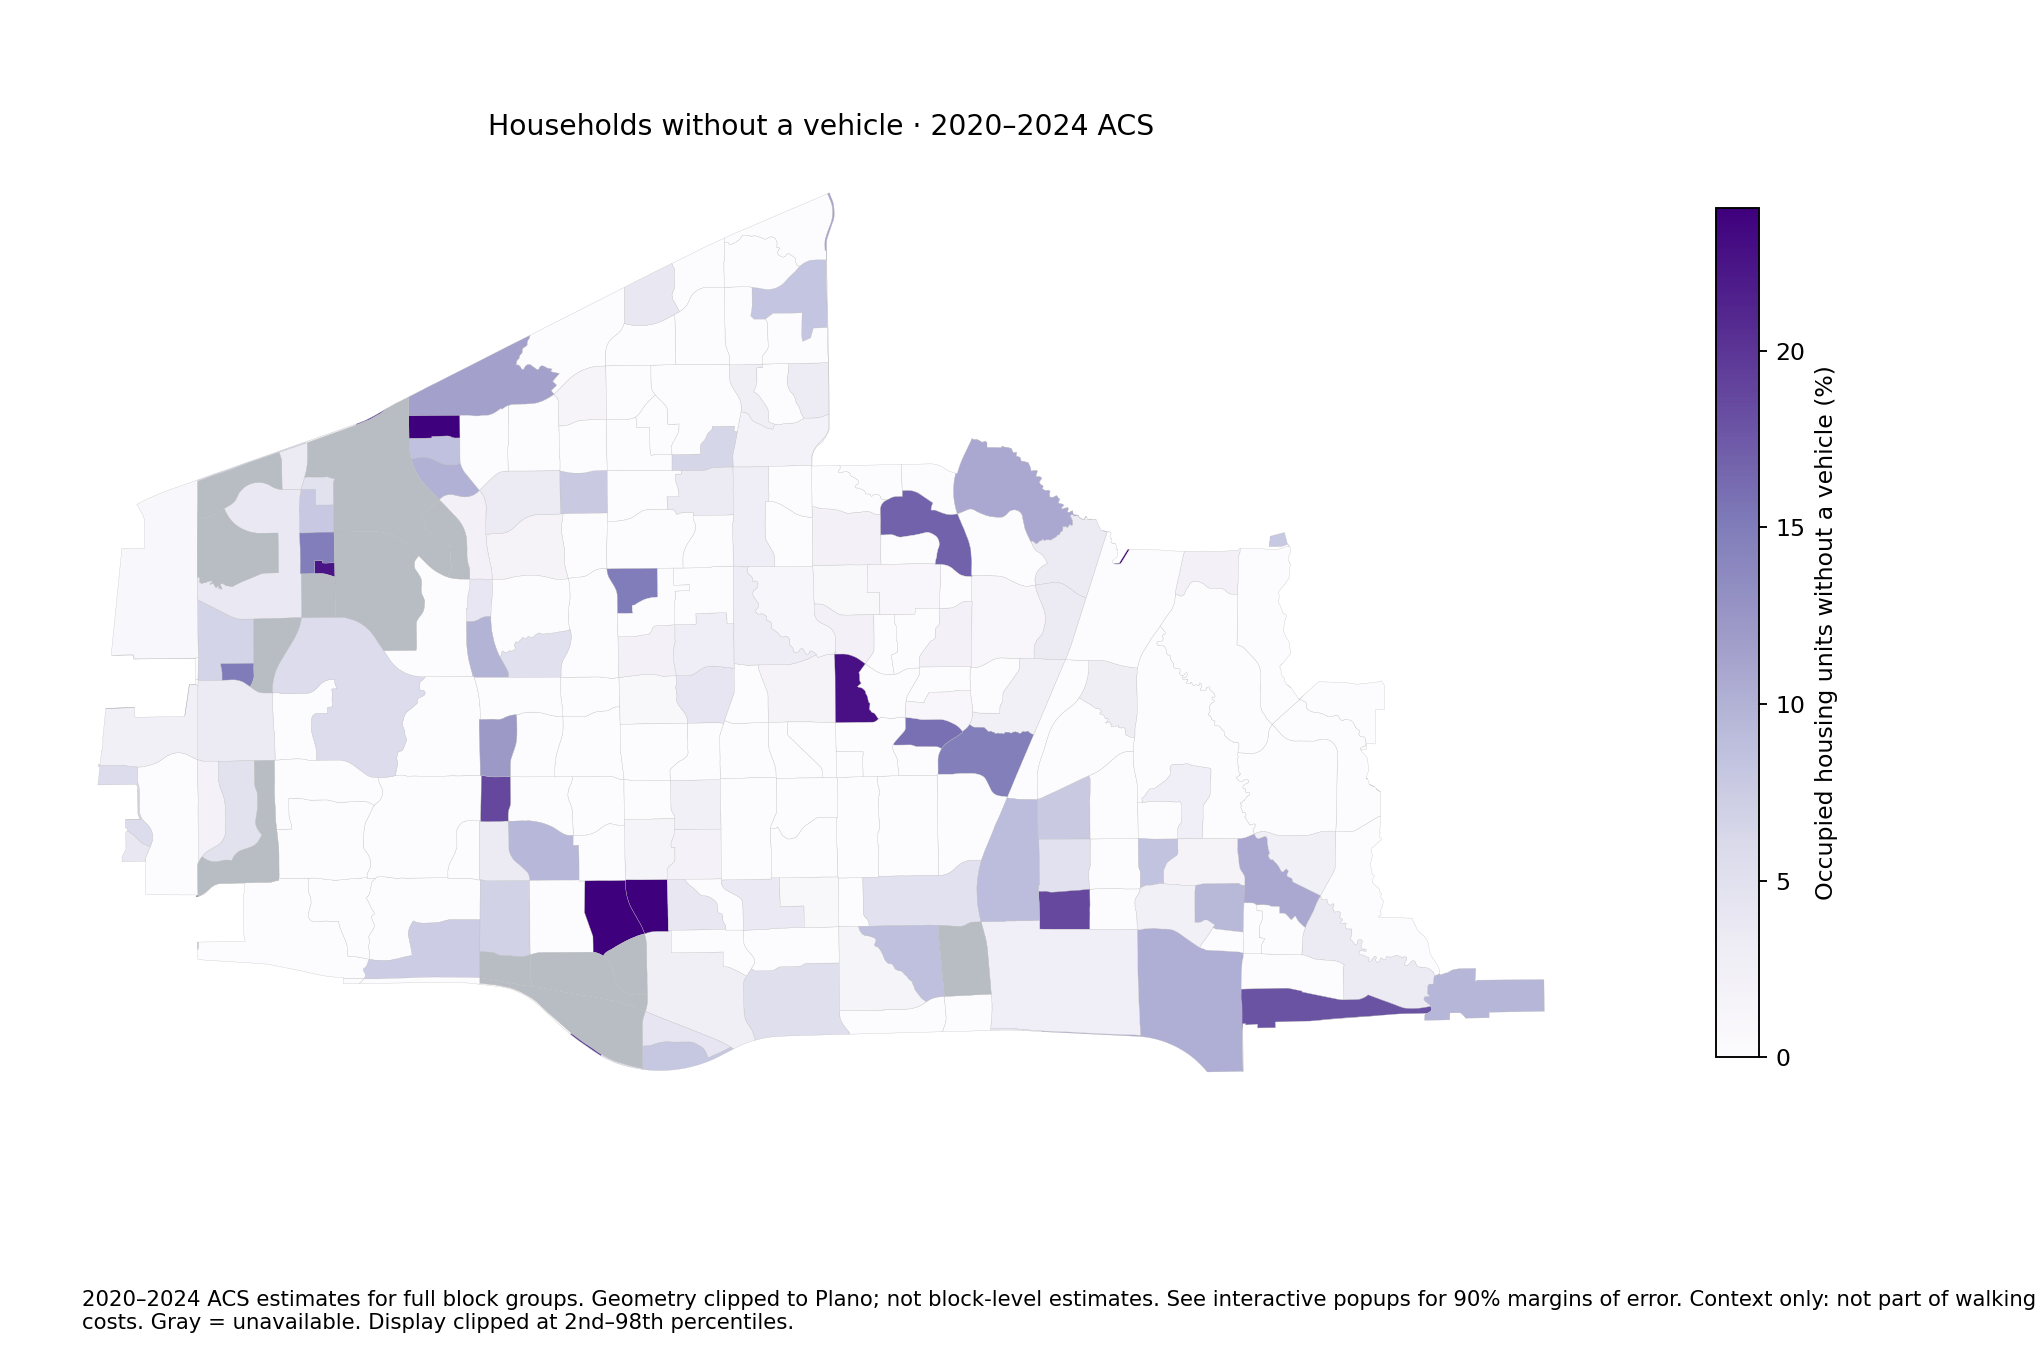
Households without a vehicle · 2020–2024 ACS
2020–2024 ACS estimates for full block groups. Geometry clipped to Plano; not block-level estimates. See interactive popups for 90% margins of error. Context only: not part of walking costs. Gray = unavailable. Display clipped at 2nd–98th percentiles.Download PNG
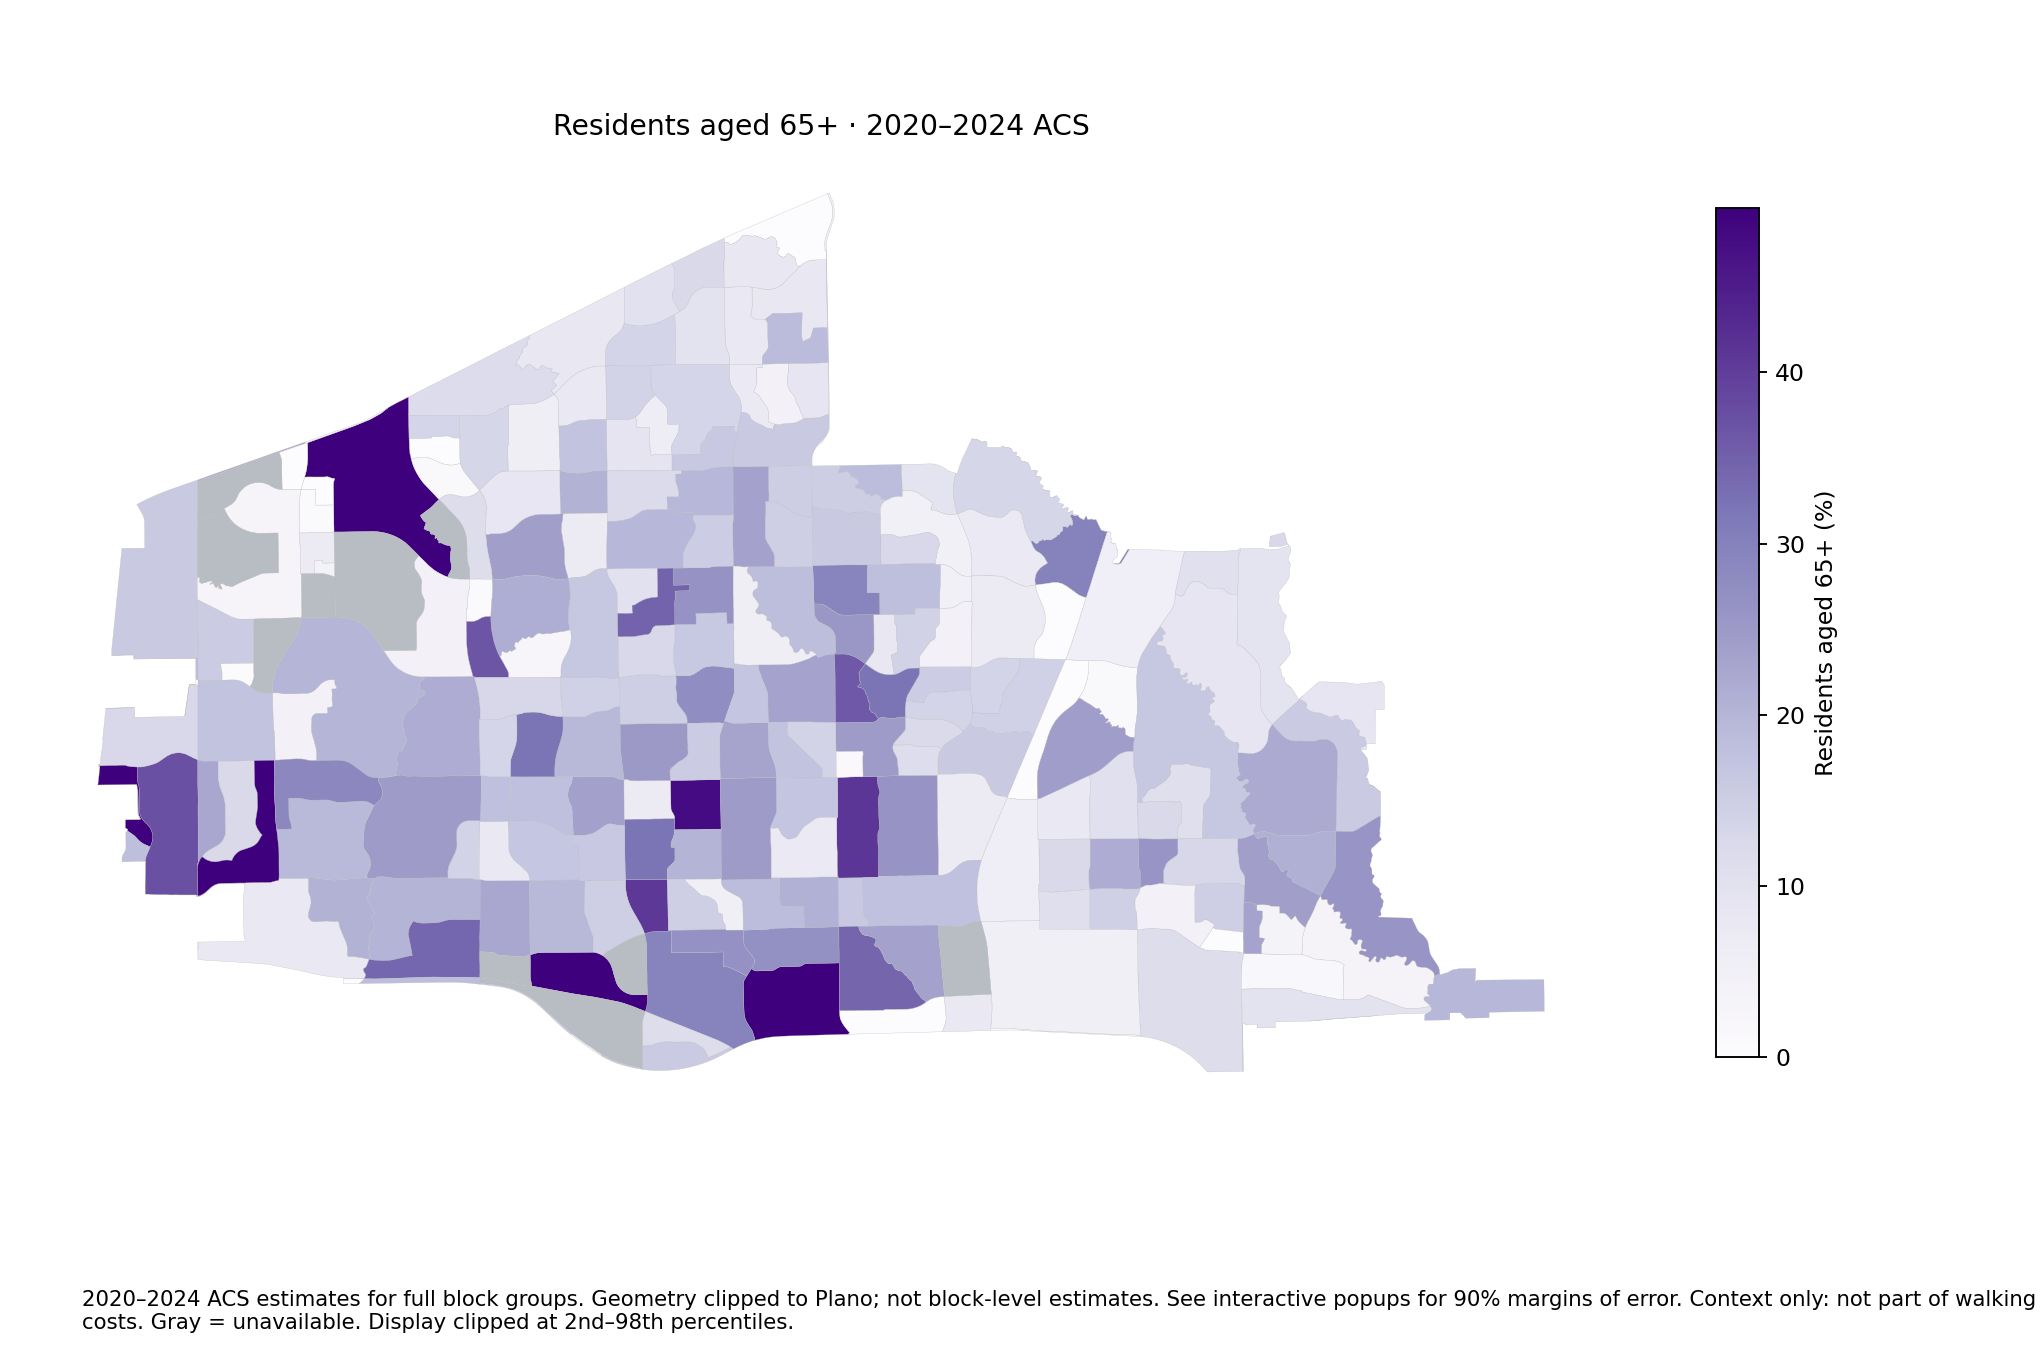
Residents aged 65+ · 2020–2024 ACS
2020–2024 ACS estimates for full block groups. Geometry clipped to Plano; not block-level estimates. See interactive popups for 90% margins of error. Context only: not part of walking costs. Gray = unavailable. Display clipped at 2nd–98th percentiles.Download PNG
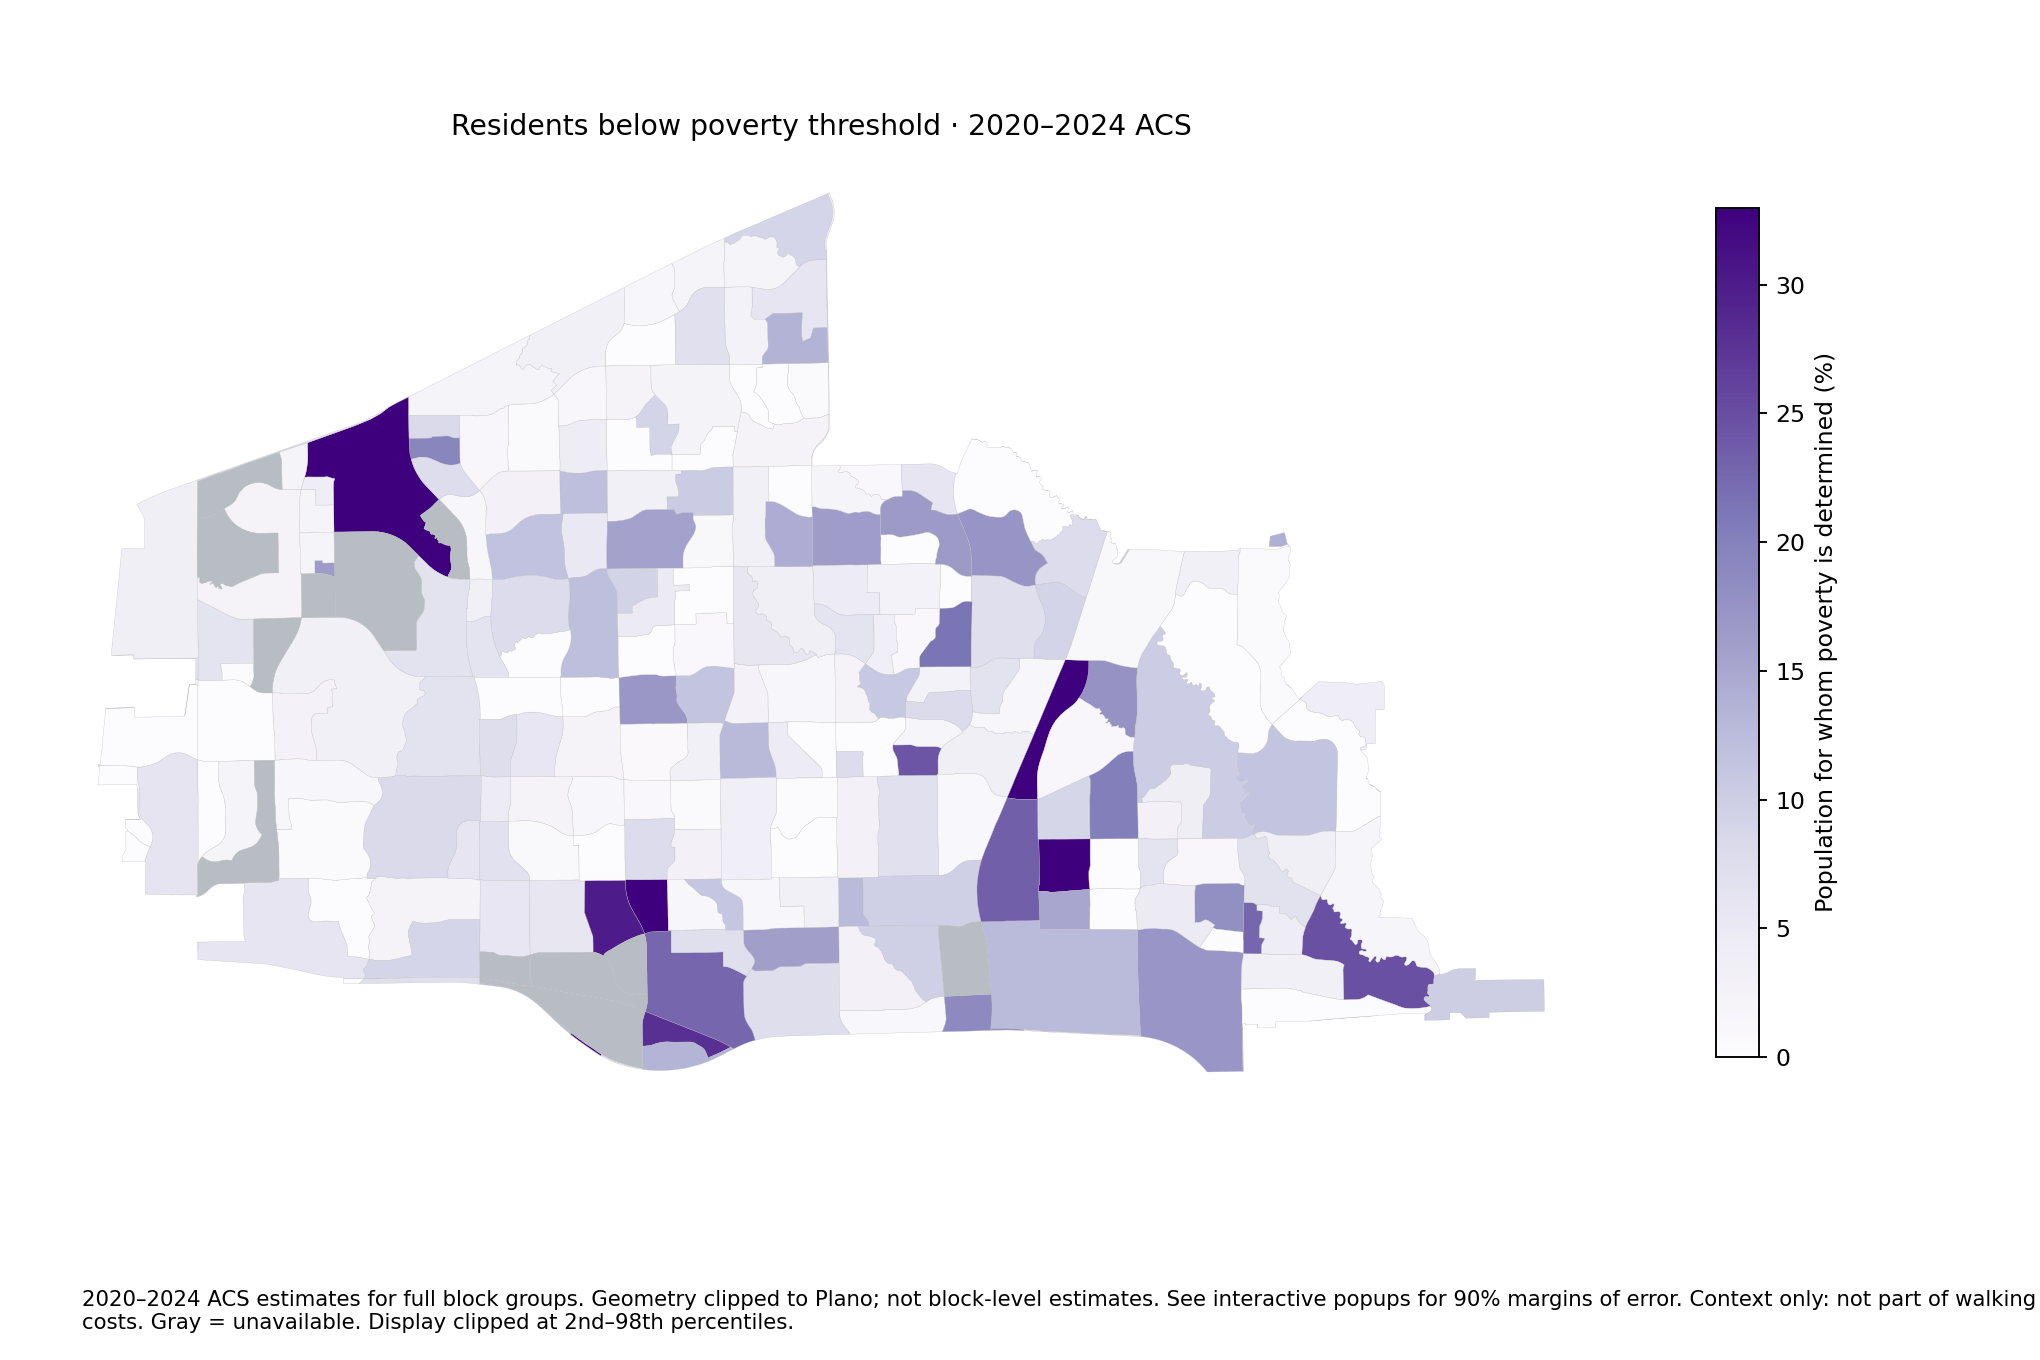
Residents below poverty threshold · 2020–2024 ACS
2020–2024 ACS estimates for full block groups. Geometry clipped to Plano; not block-level estimates. See interactive popups for 90% margins of error. Context only: not part of walking costs. Gray = unavailable. Display clipped at 2nd–98th percentiles.Download PNG
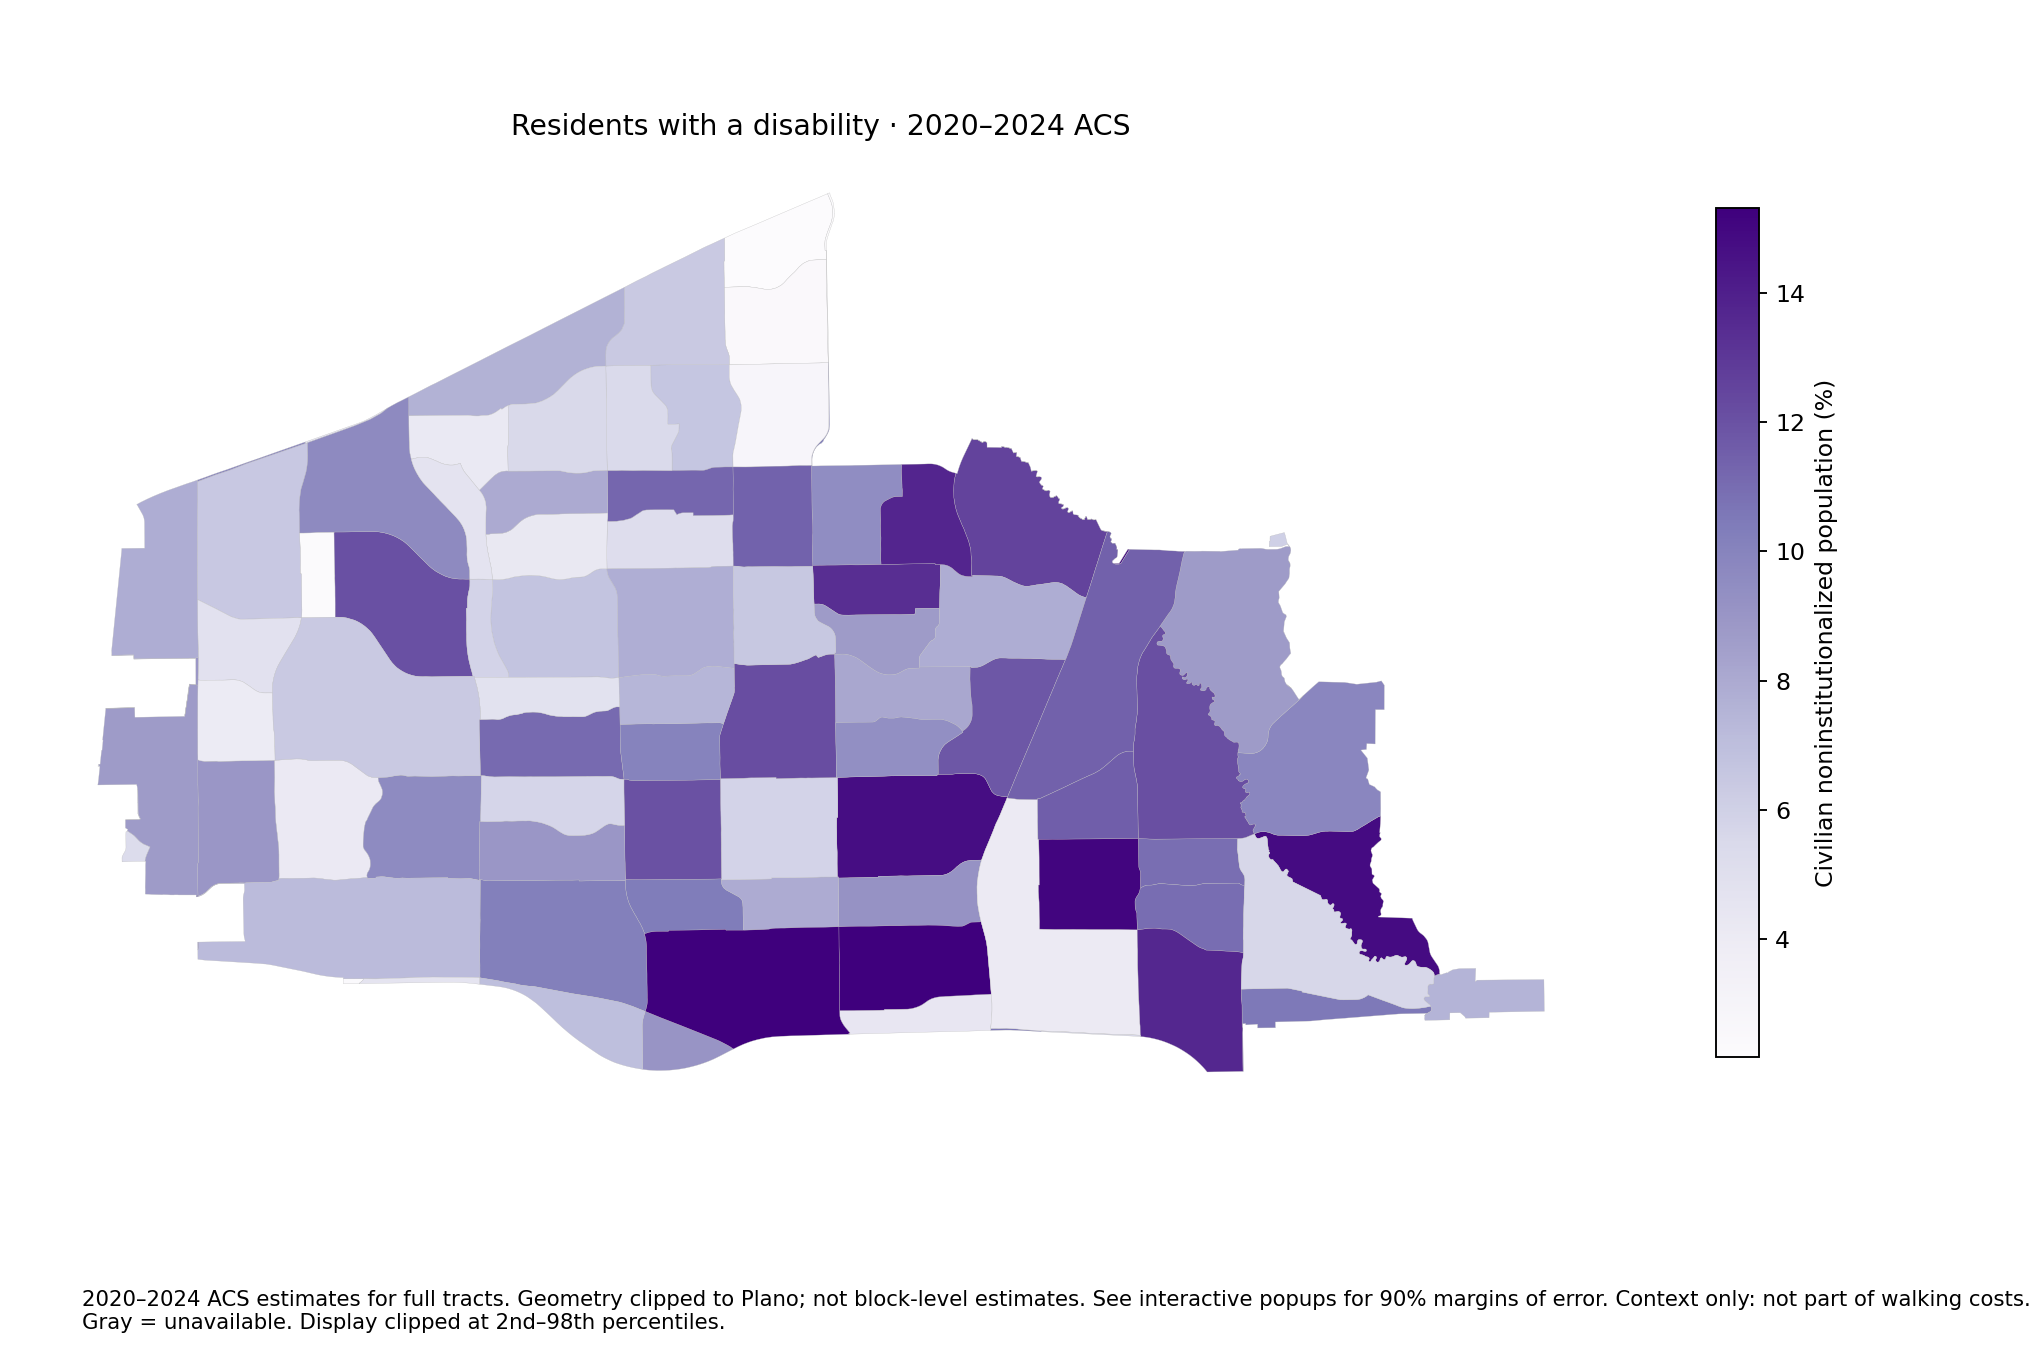
Residents with a disability · 2020–2024 ACS
2020–2024 ACS estimates for full tracts. Geometry clipped to Plano; not block-level estimates. See interactive popups for 90% margins of error. Context only: not part of walking costs. Gray = unavailable. Display clipped at 2nd–98th percentiles.Download PNG
Archived four-ZIP environmental proxies and Landsat heat
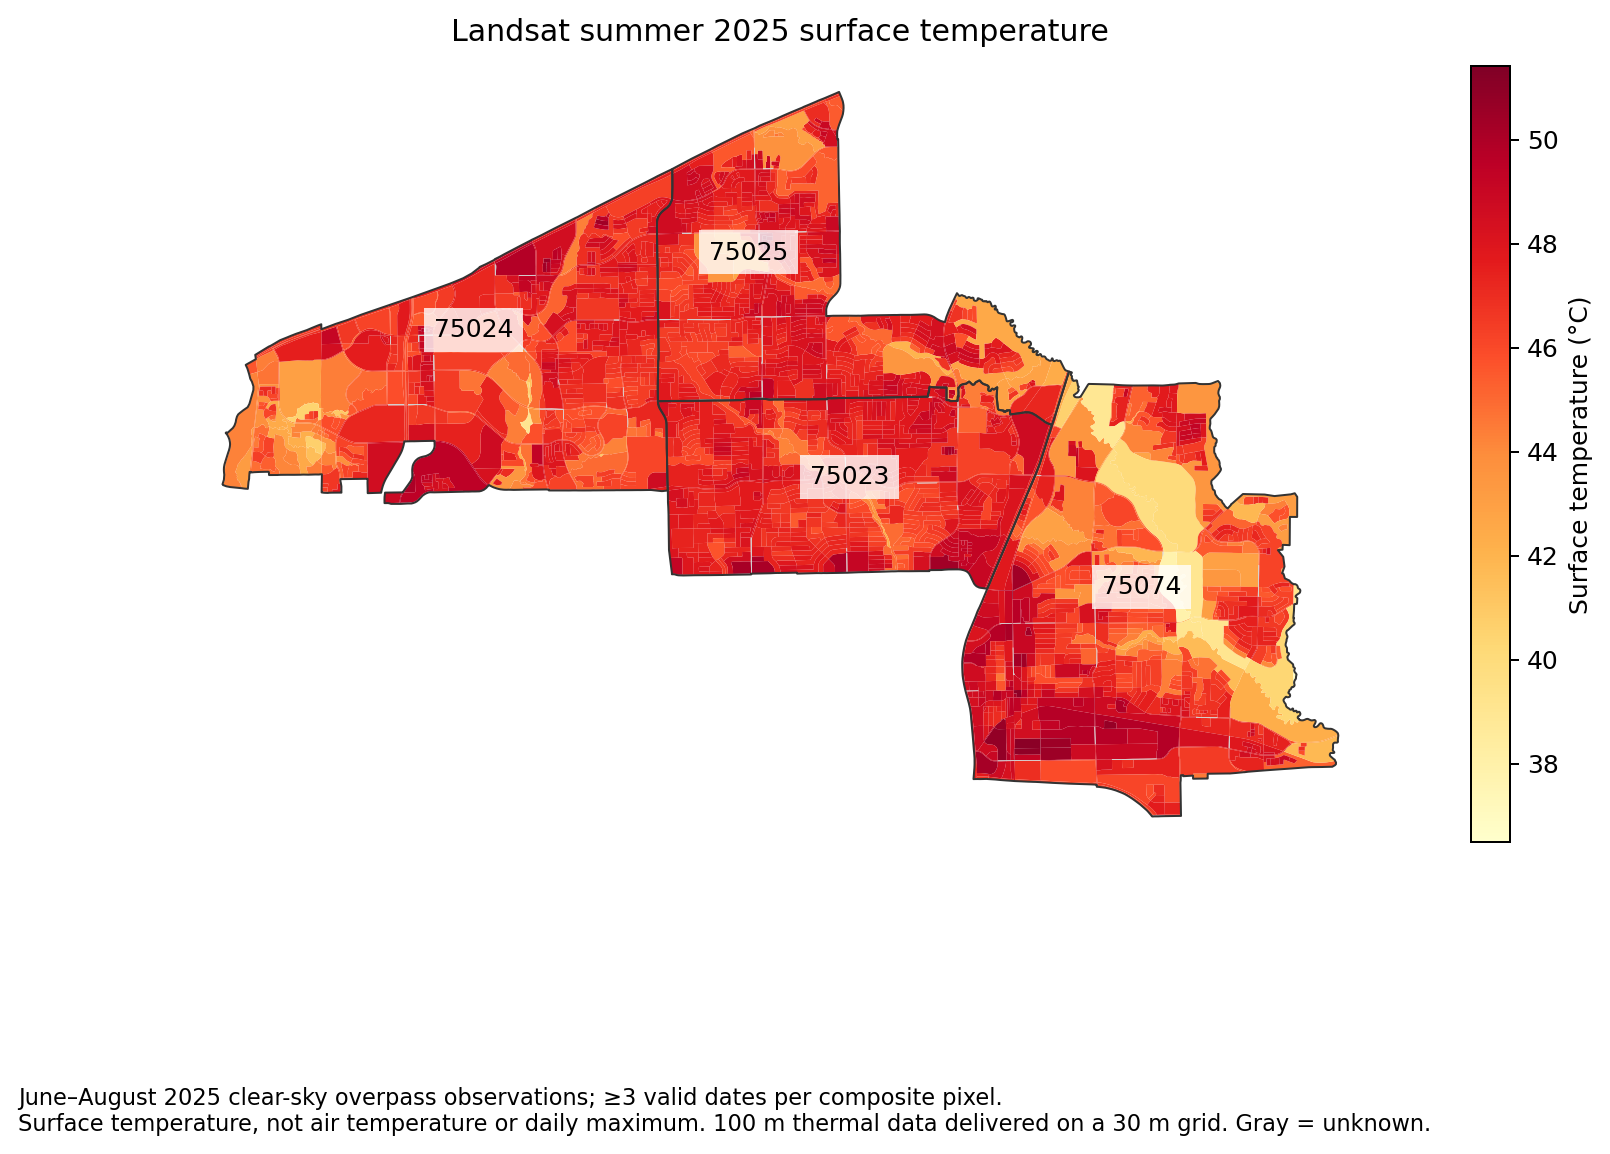
Landsat summer 2025 surface temperature
June–August 2025 clear-sky overpass observations; ≥3 valid dates per composite pixel.
Surface temperature, not air temperature or daily maximum. 100 m thermal data delivered on a 30 m grid. Gray = unknown.Download PNG
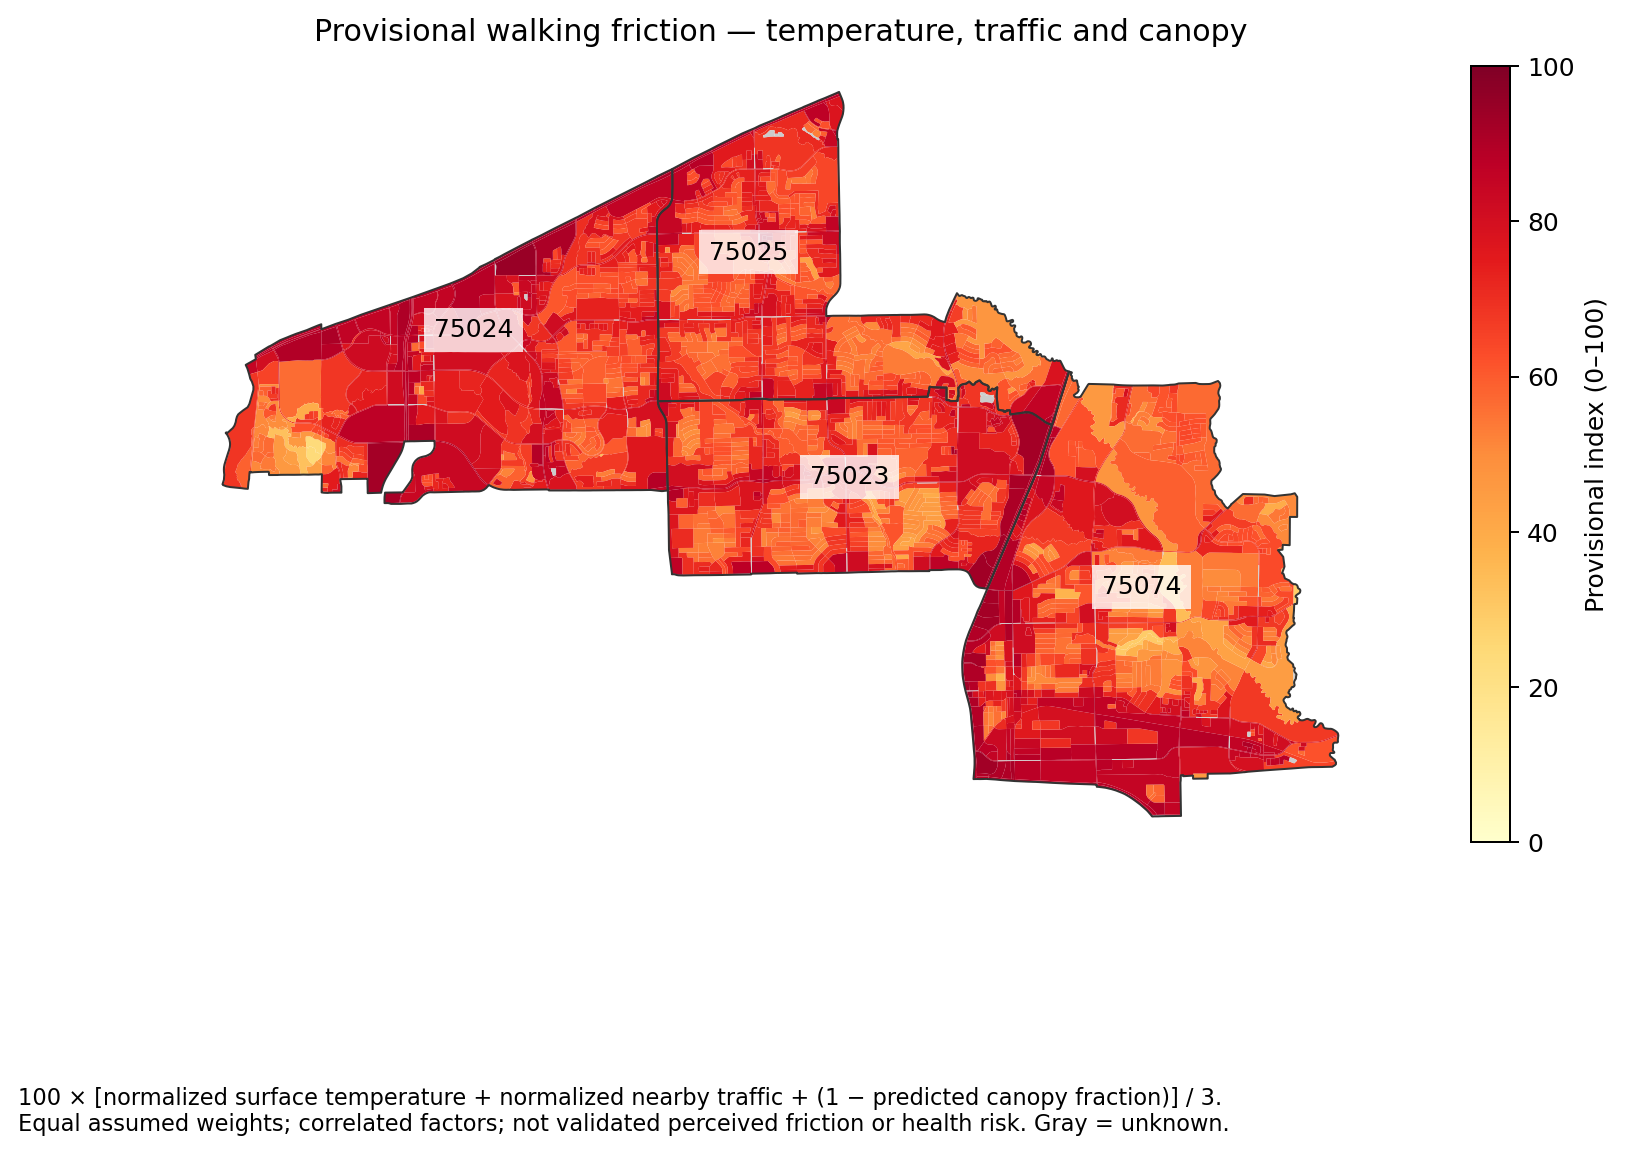
100 × [normalized surface temperature + normalized nearby traffic + (1 − predicted canopy fraction)] / 3.
Equal assumed weights; correlated factors; not validated perceived friction or health risk. Gray = unknown.Download PNG
Archived four-ZIP GeoAI maps
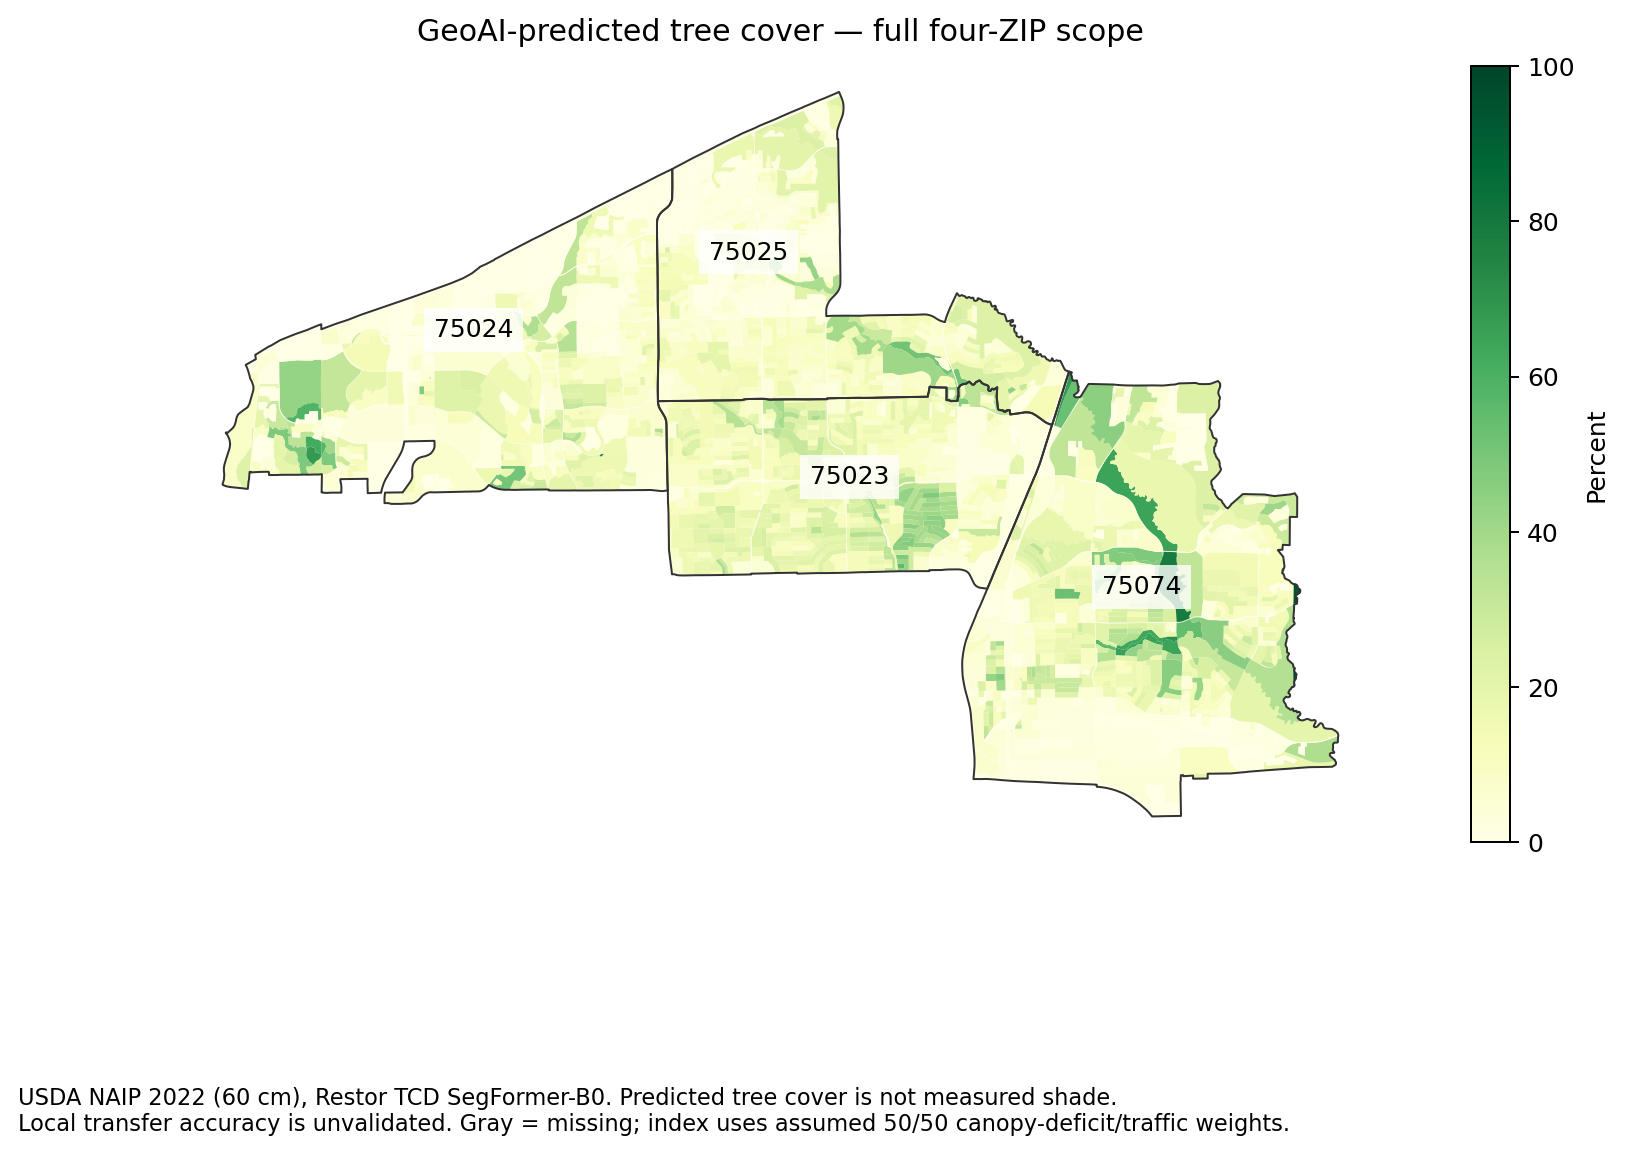
full geoai tree cover
USDA NAIP 2022 (60 cm), Restor TCD SegFormer-B0. Predicted tree cover is not measured shade.
Local transfer accuracy is unvalidated. Gray = missing; index uses assumed 50/50 canopy-deficit/traffic weights.Download PNG
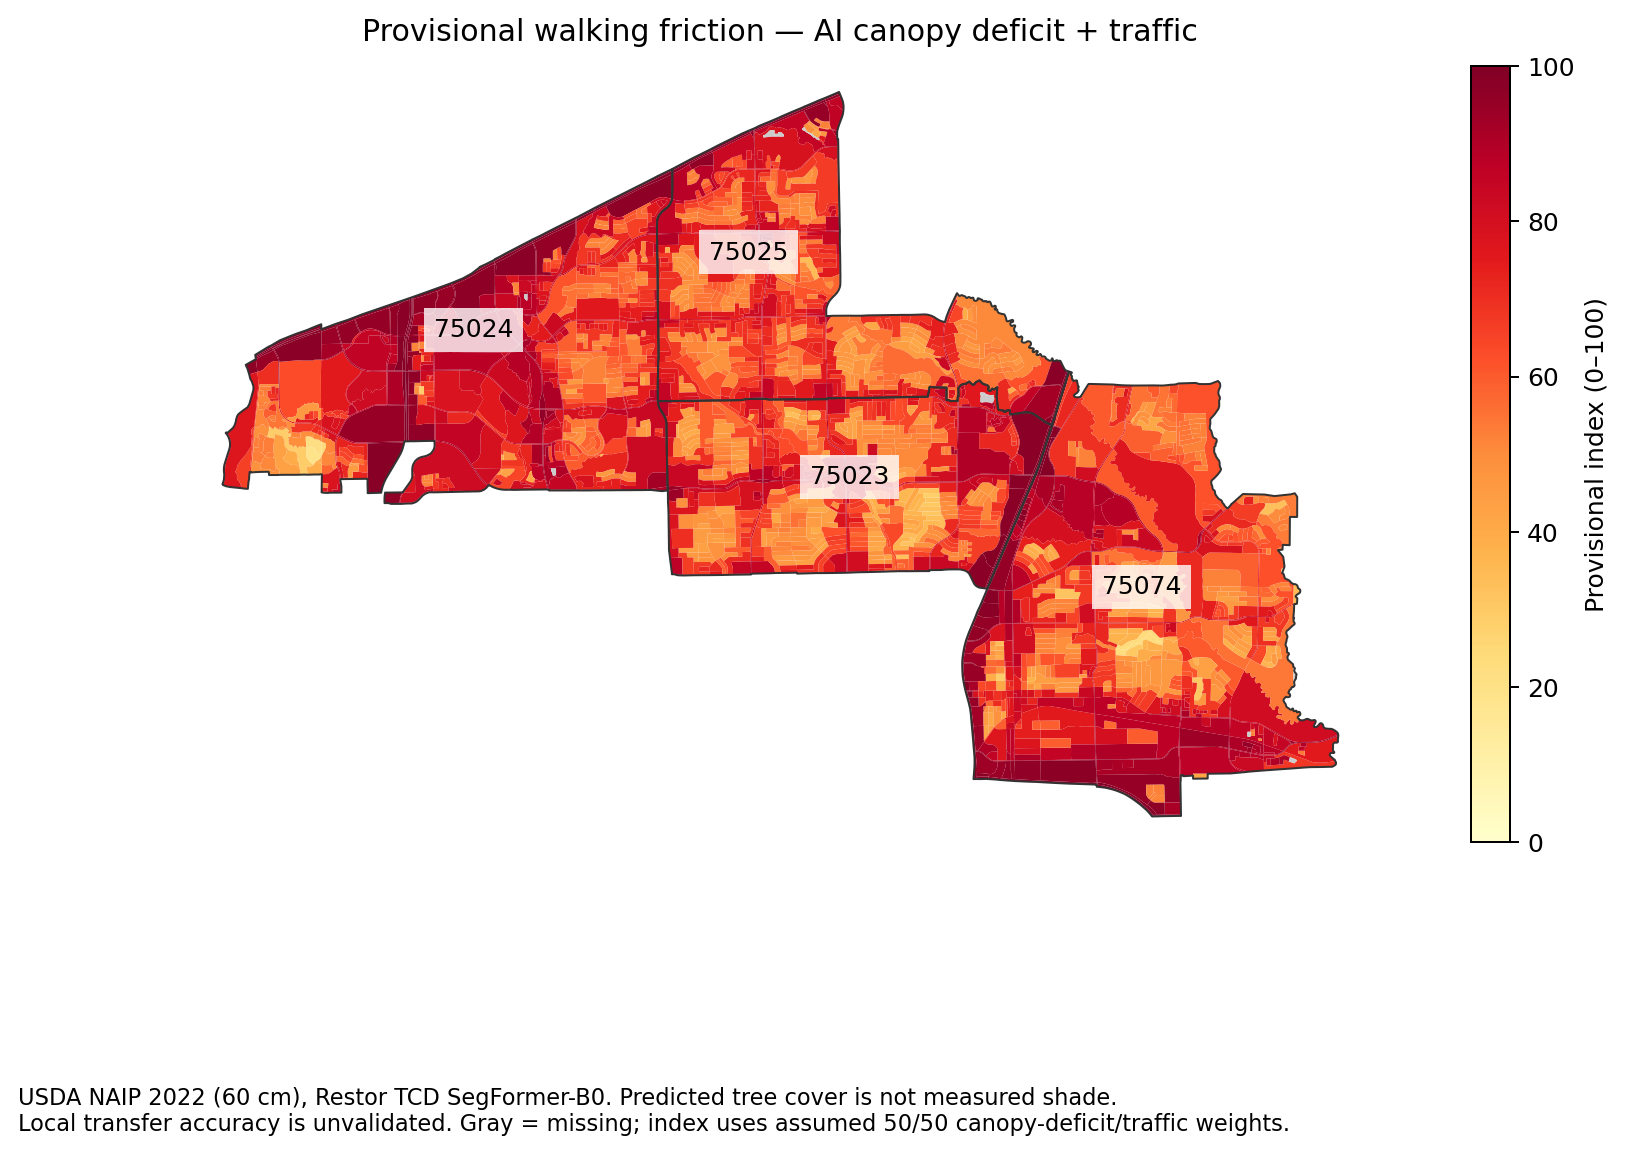
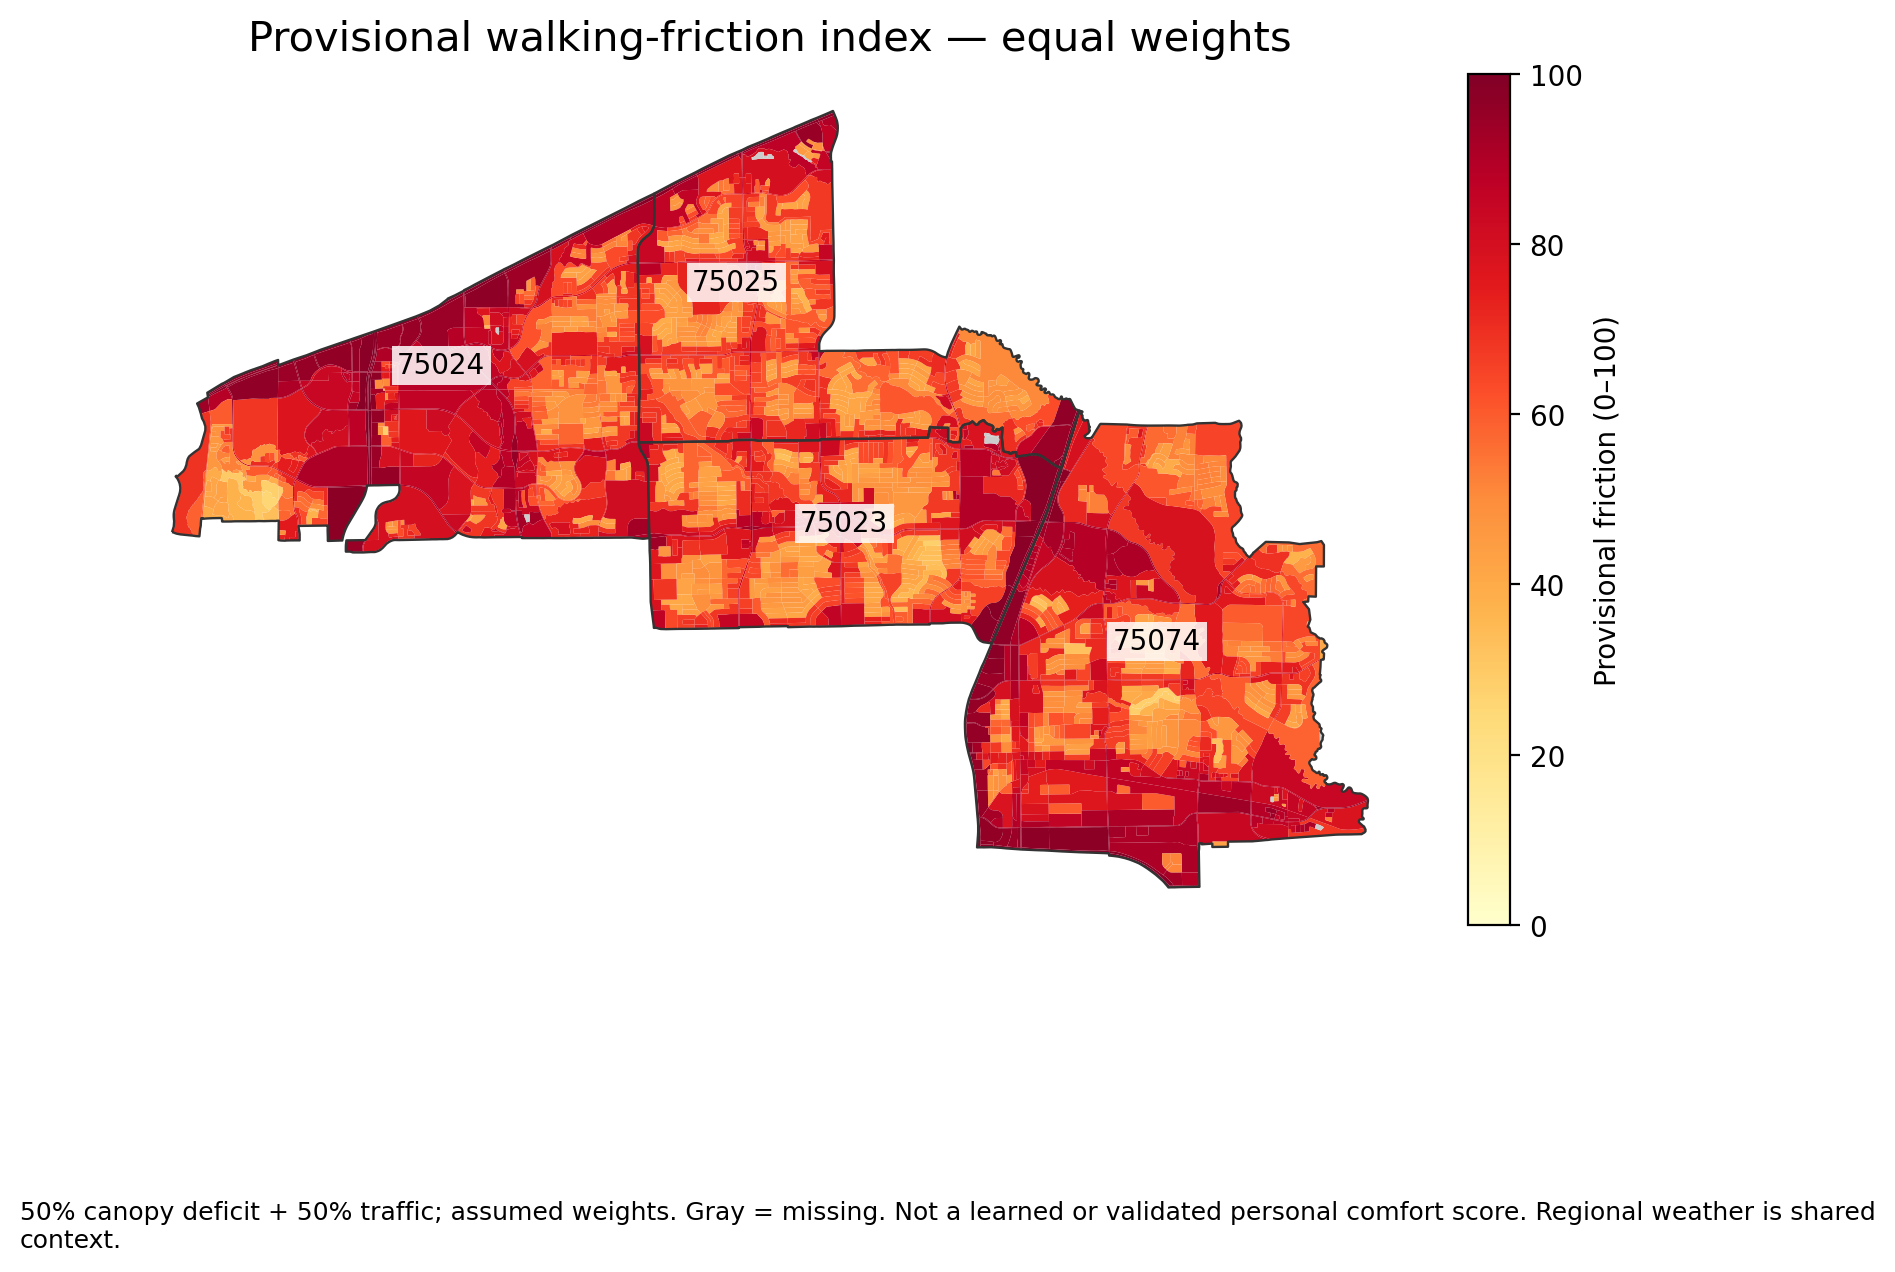
Earlier environmental proxy — full geoai walking friction
USDA NAIP 2022 (60 cm), Restor TCD SegFormer-B0. Predicted tree cover is not measured shade.
Local transfer accuracy is unvalidated. Gray = missing; index uses assumed 50/50 canopy-deficit/traffic weights.Download PNG
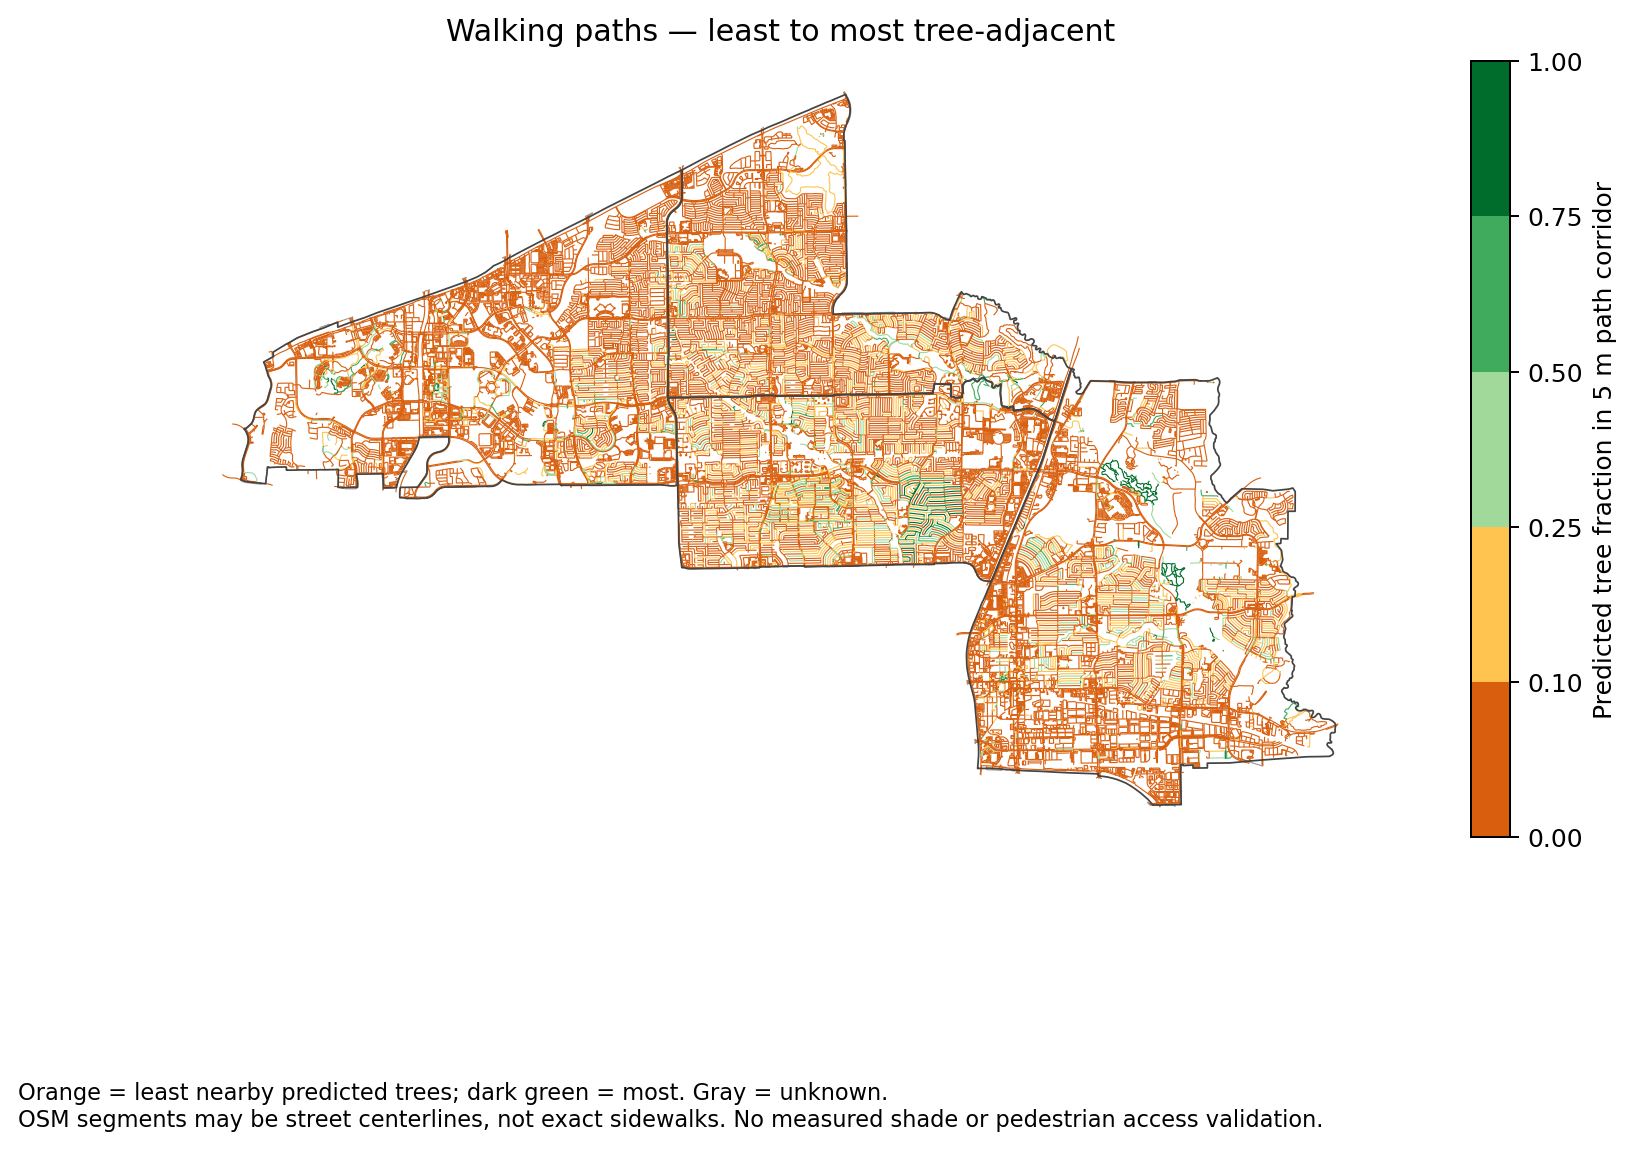
full geoai tree adjacent paths
Orange = least nearby predicted trees; dark green = most. Gray = unknown.
OSM segments may be street centerlines, not exact sidewalks. No measured shade or pedestrian access validation.Download PNG
Archived four-ZIP environment and network layers
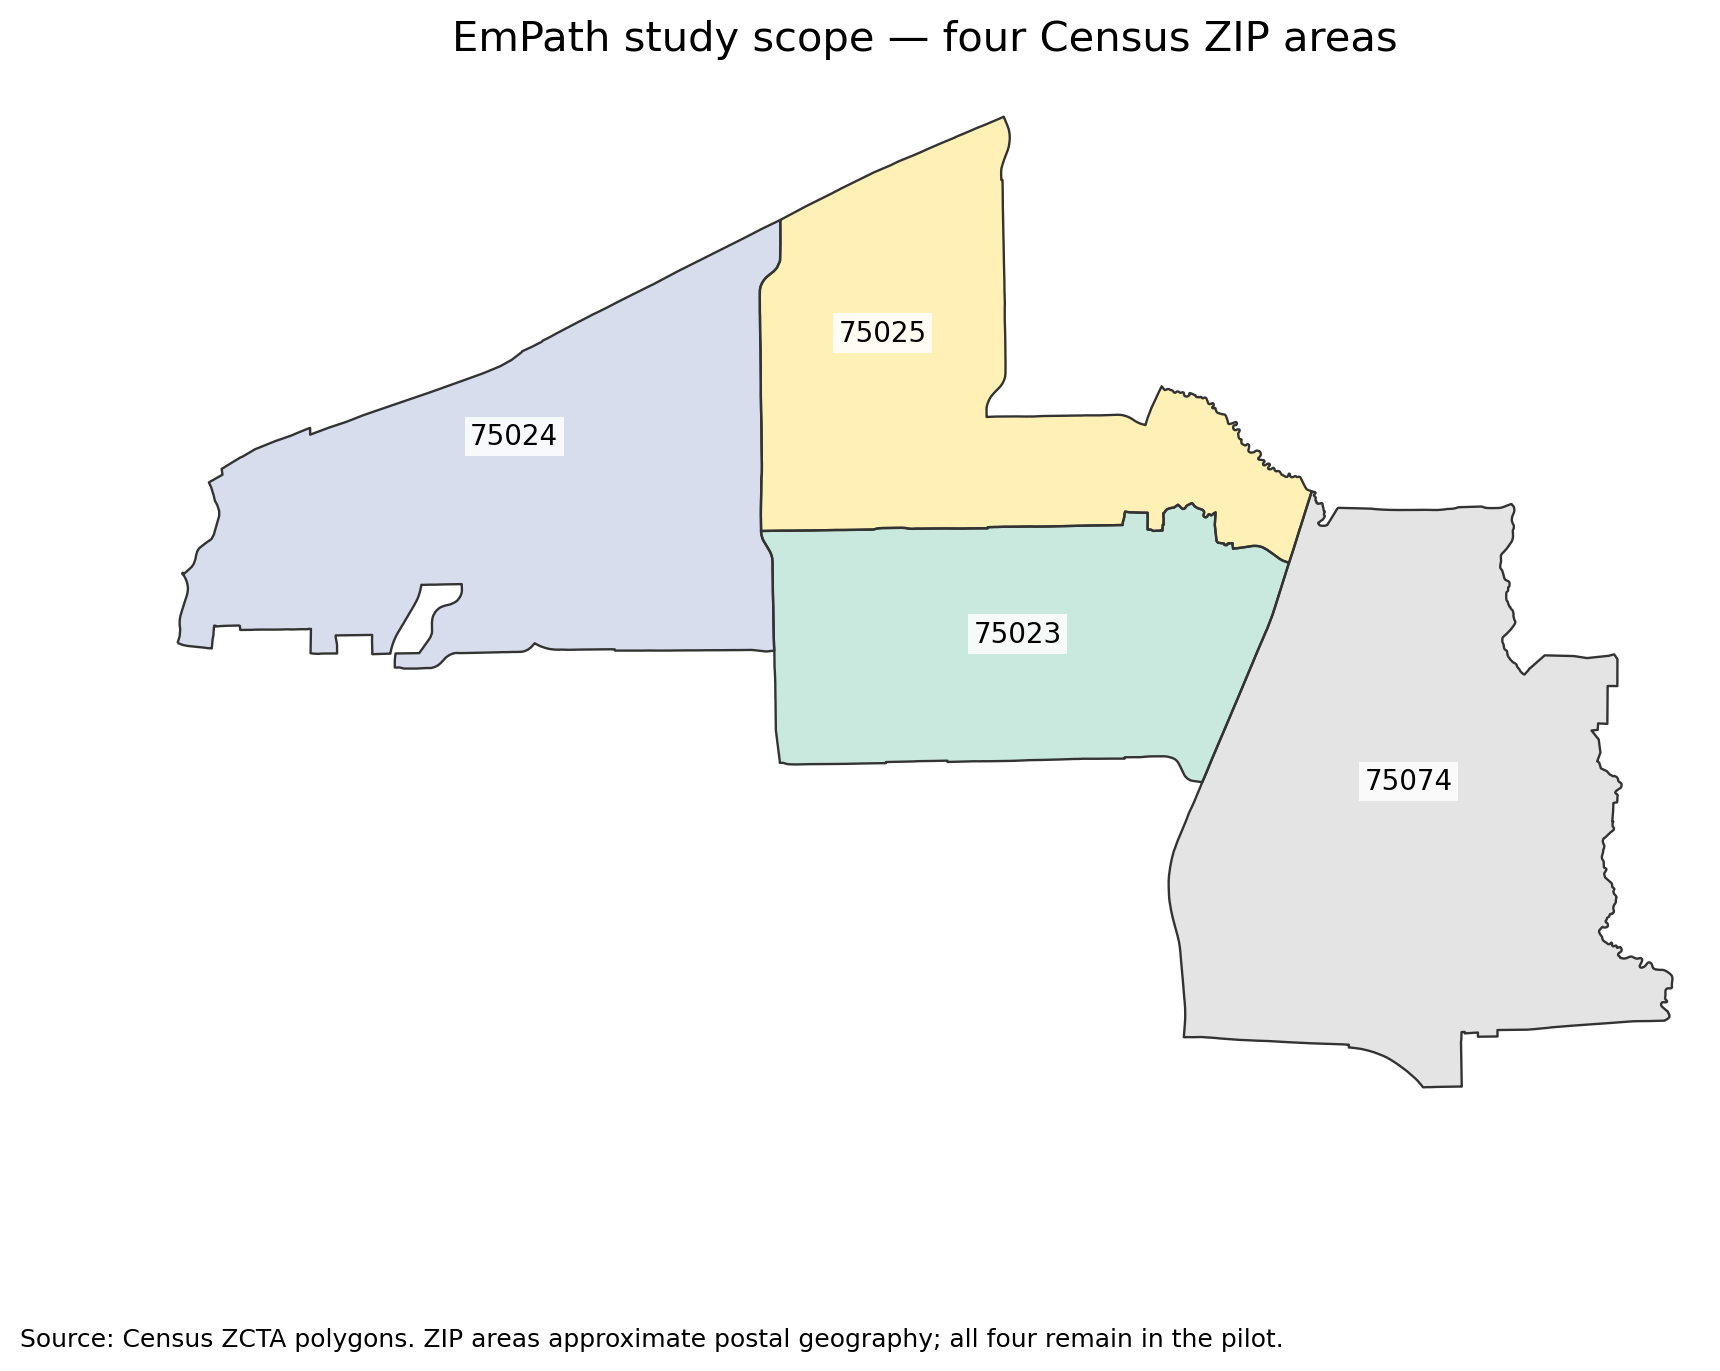
01 four zip scope
Source: Census ZCTA polygons. ZIP areas approximate postal geography; all four remain in the pilot.Download PNG
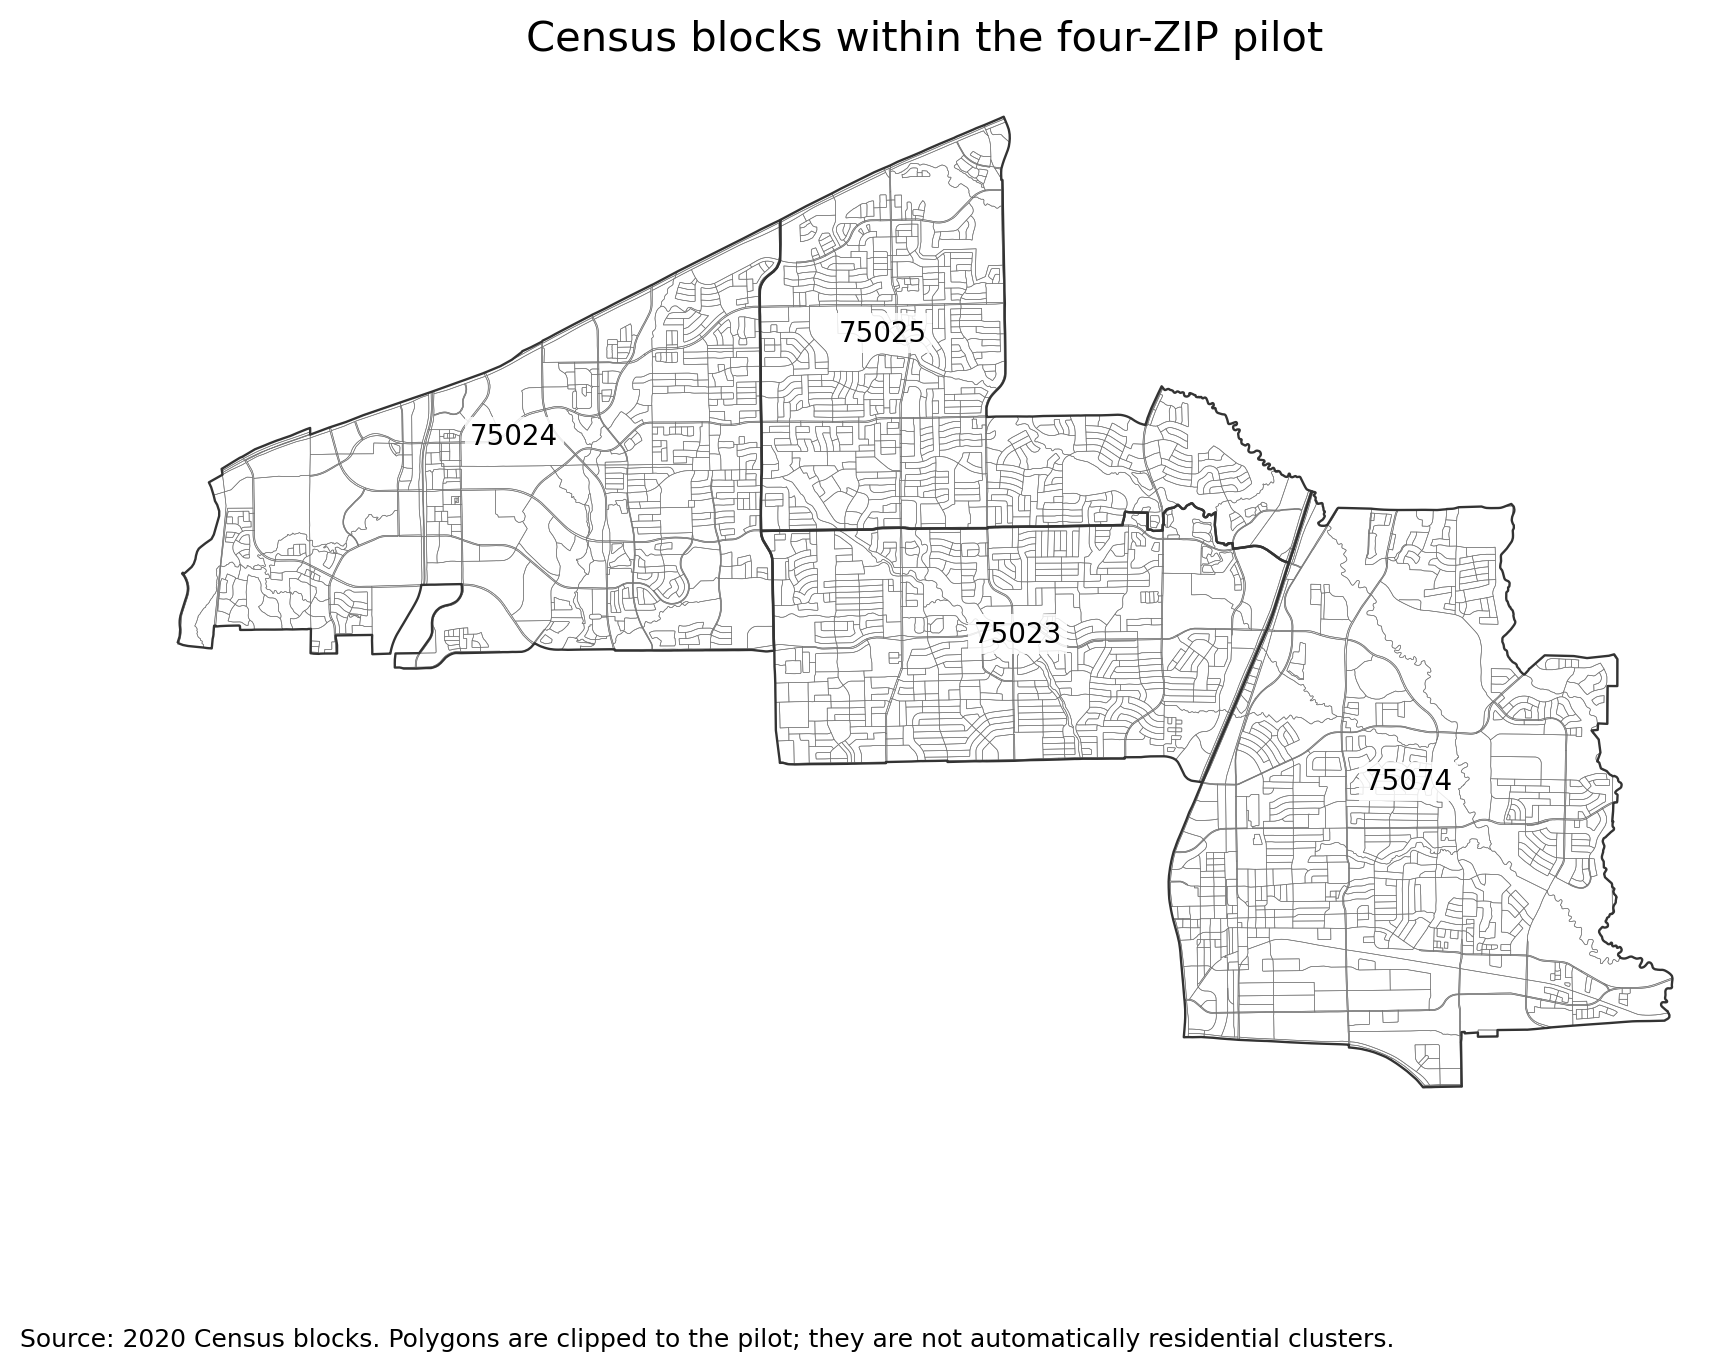
02 census blocks
Source: 2020 Census blocks. Polygons are clipped to the pilot; they are not automatically residential clusters.Download PNG
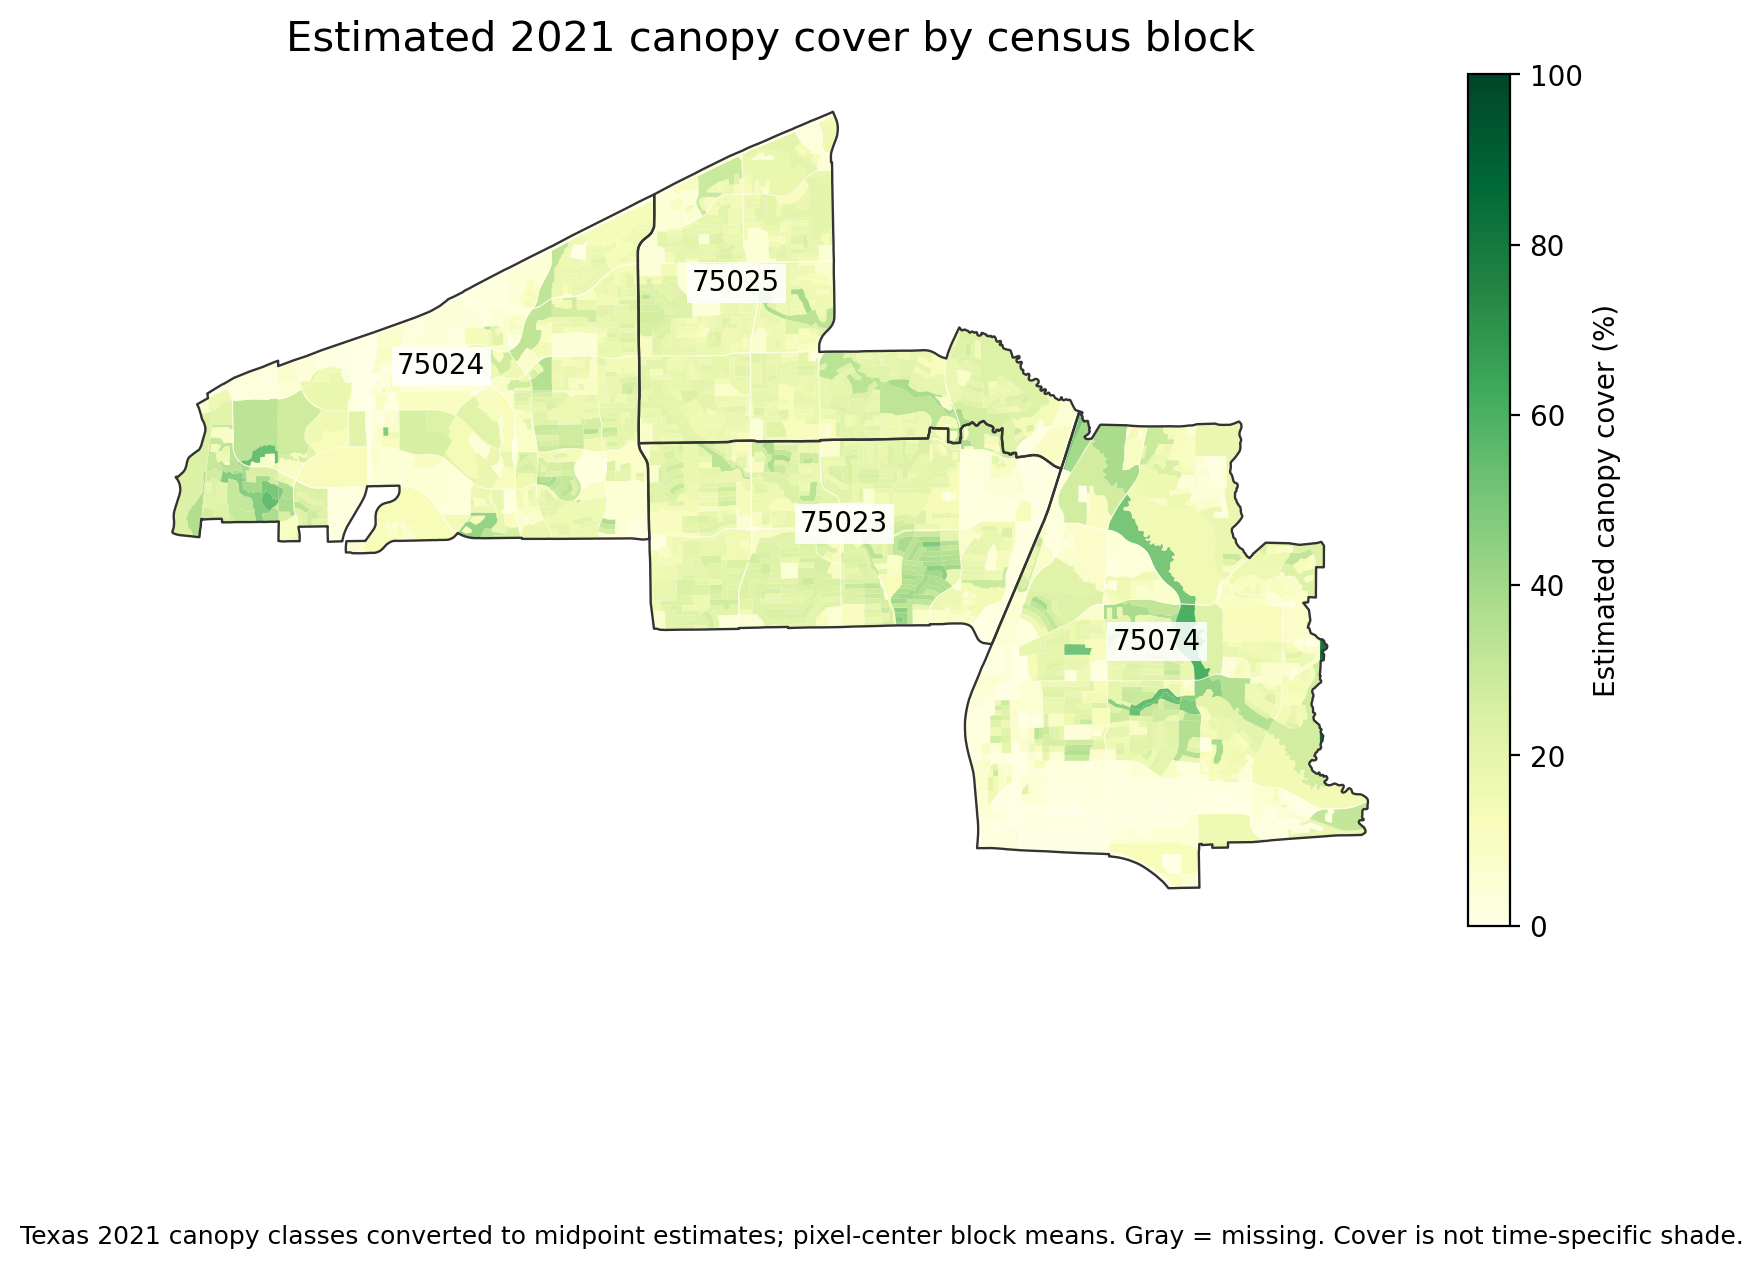
03 canopy cover
Texas 2021 canopy classes converted to midpoint estimates; pixel-center block means. Gray = missing. Cover is not time-specific shade.Download PNG
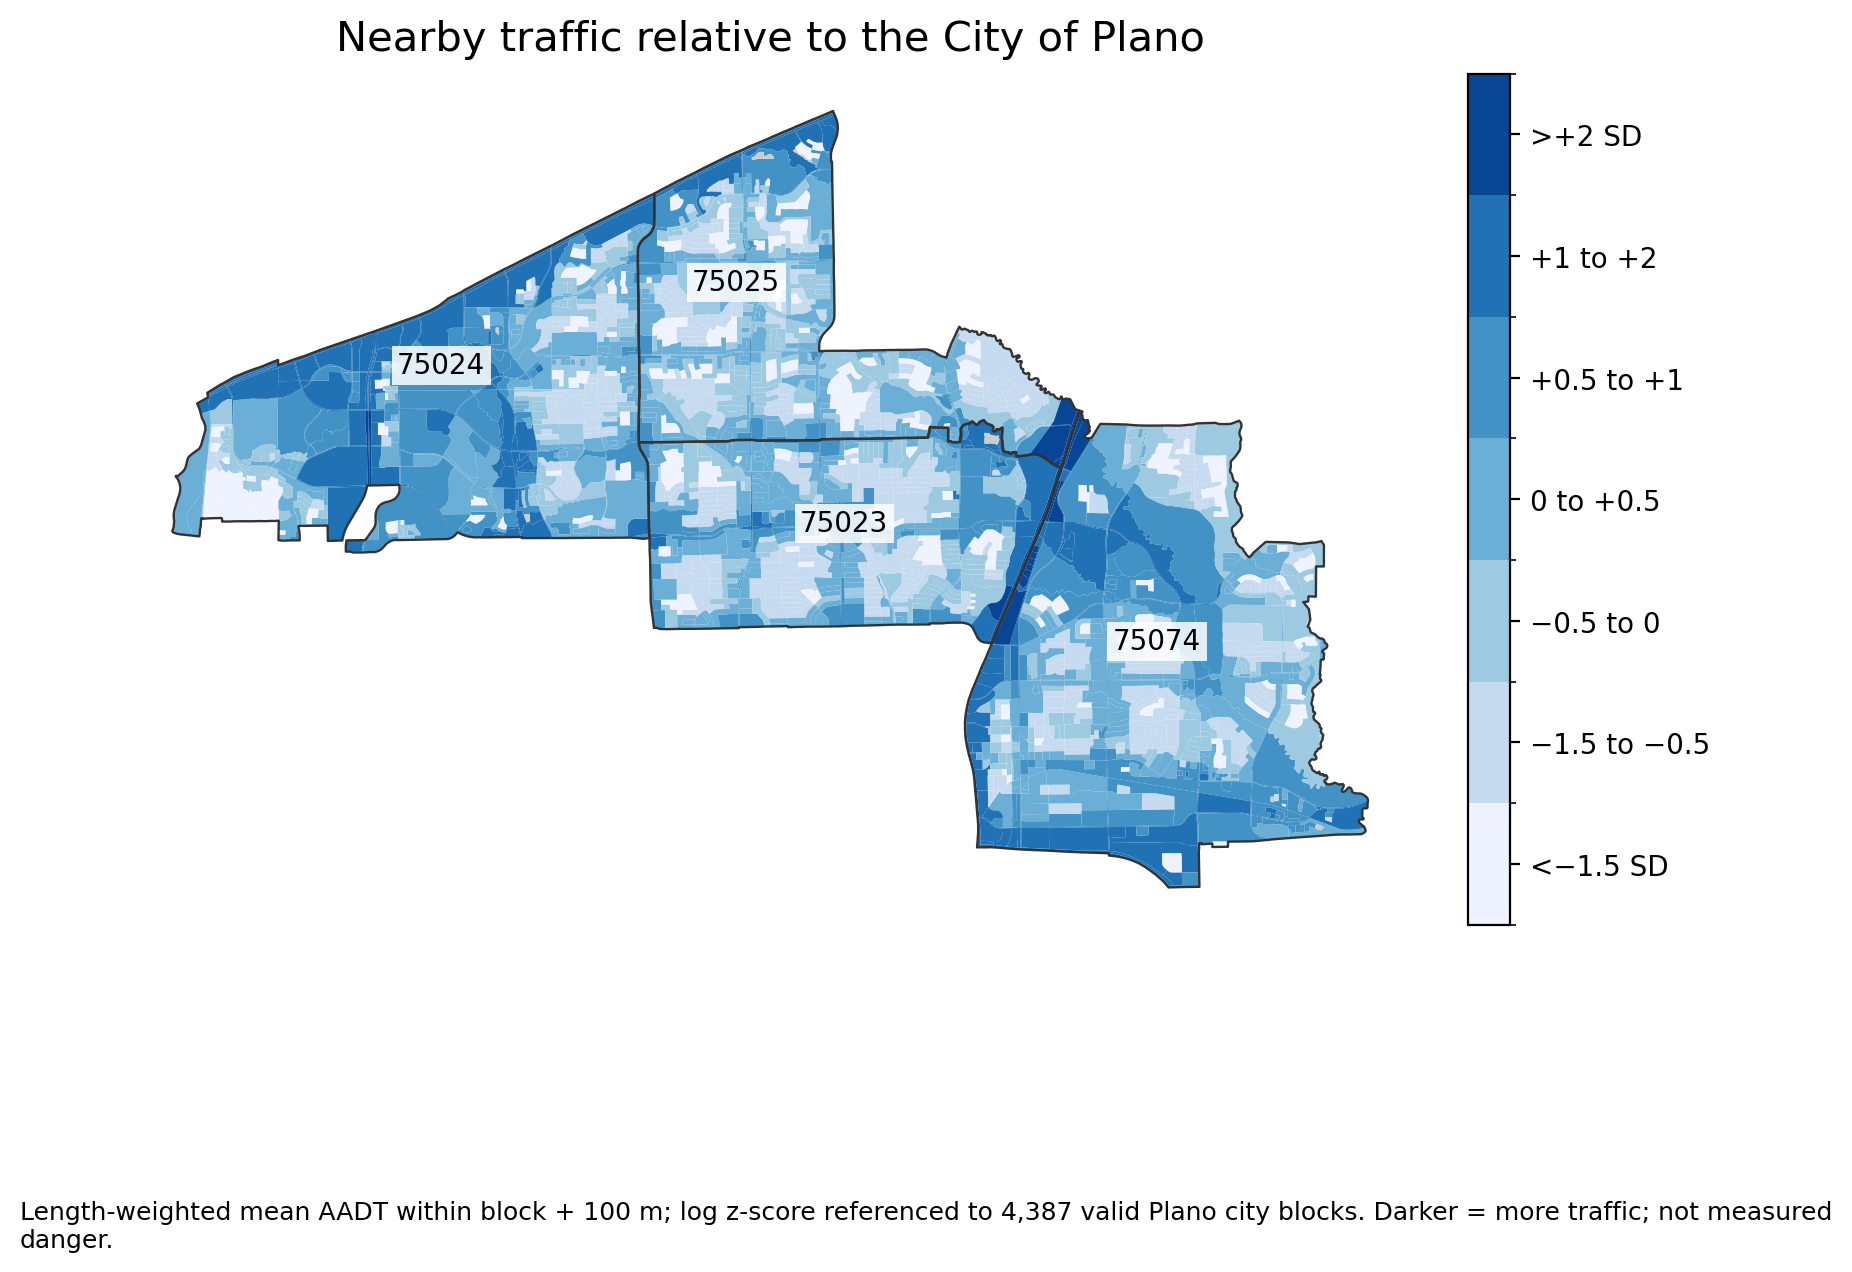
04 normalized traffic
Length-weighted mean AADT within block + 100 m; log z-score referenced to 4,387 valid Plano city blocks. Darker = more traffic; not measured danger.Download PNG
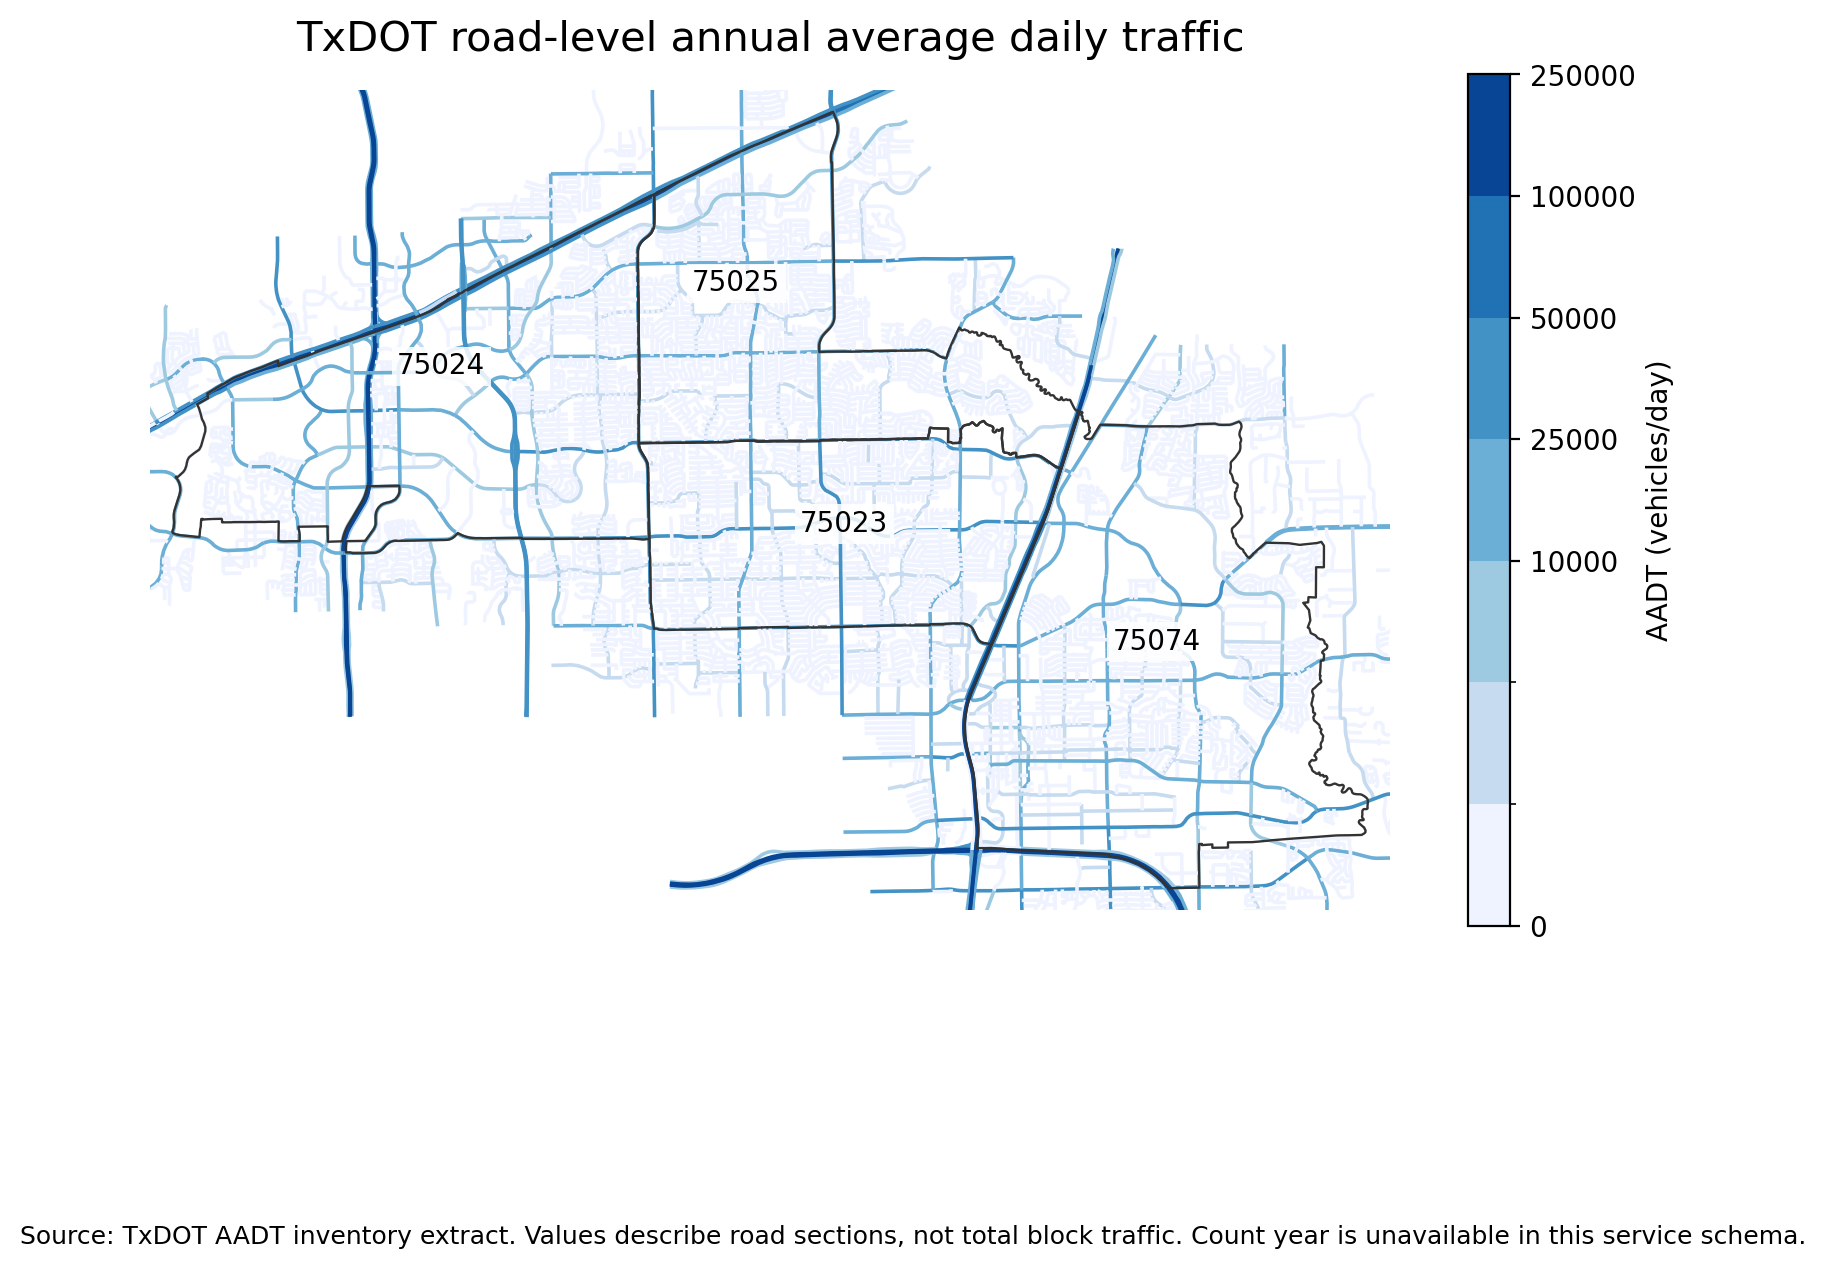
05 road traffic counts
Source: TxDOT AADT inventory extract. Values describe road sections, not total block traffic. Count year is unavailable in this service schema.Download PNG
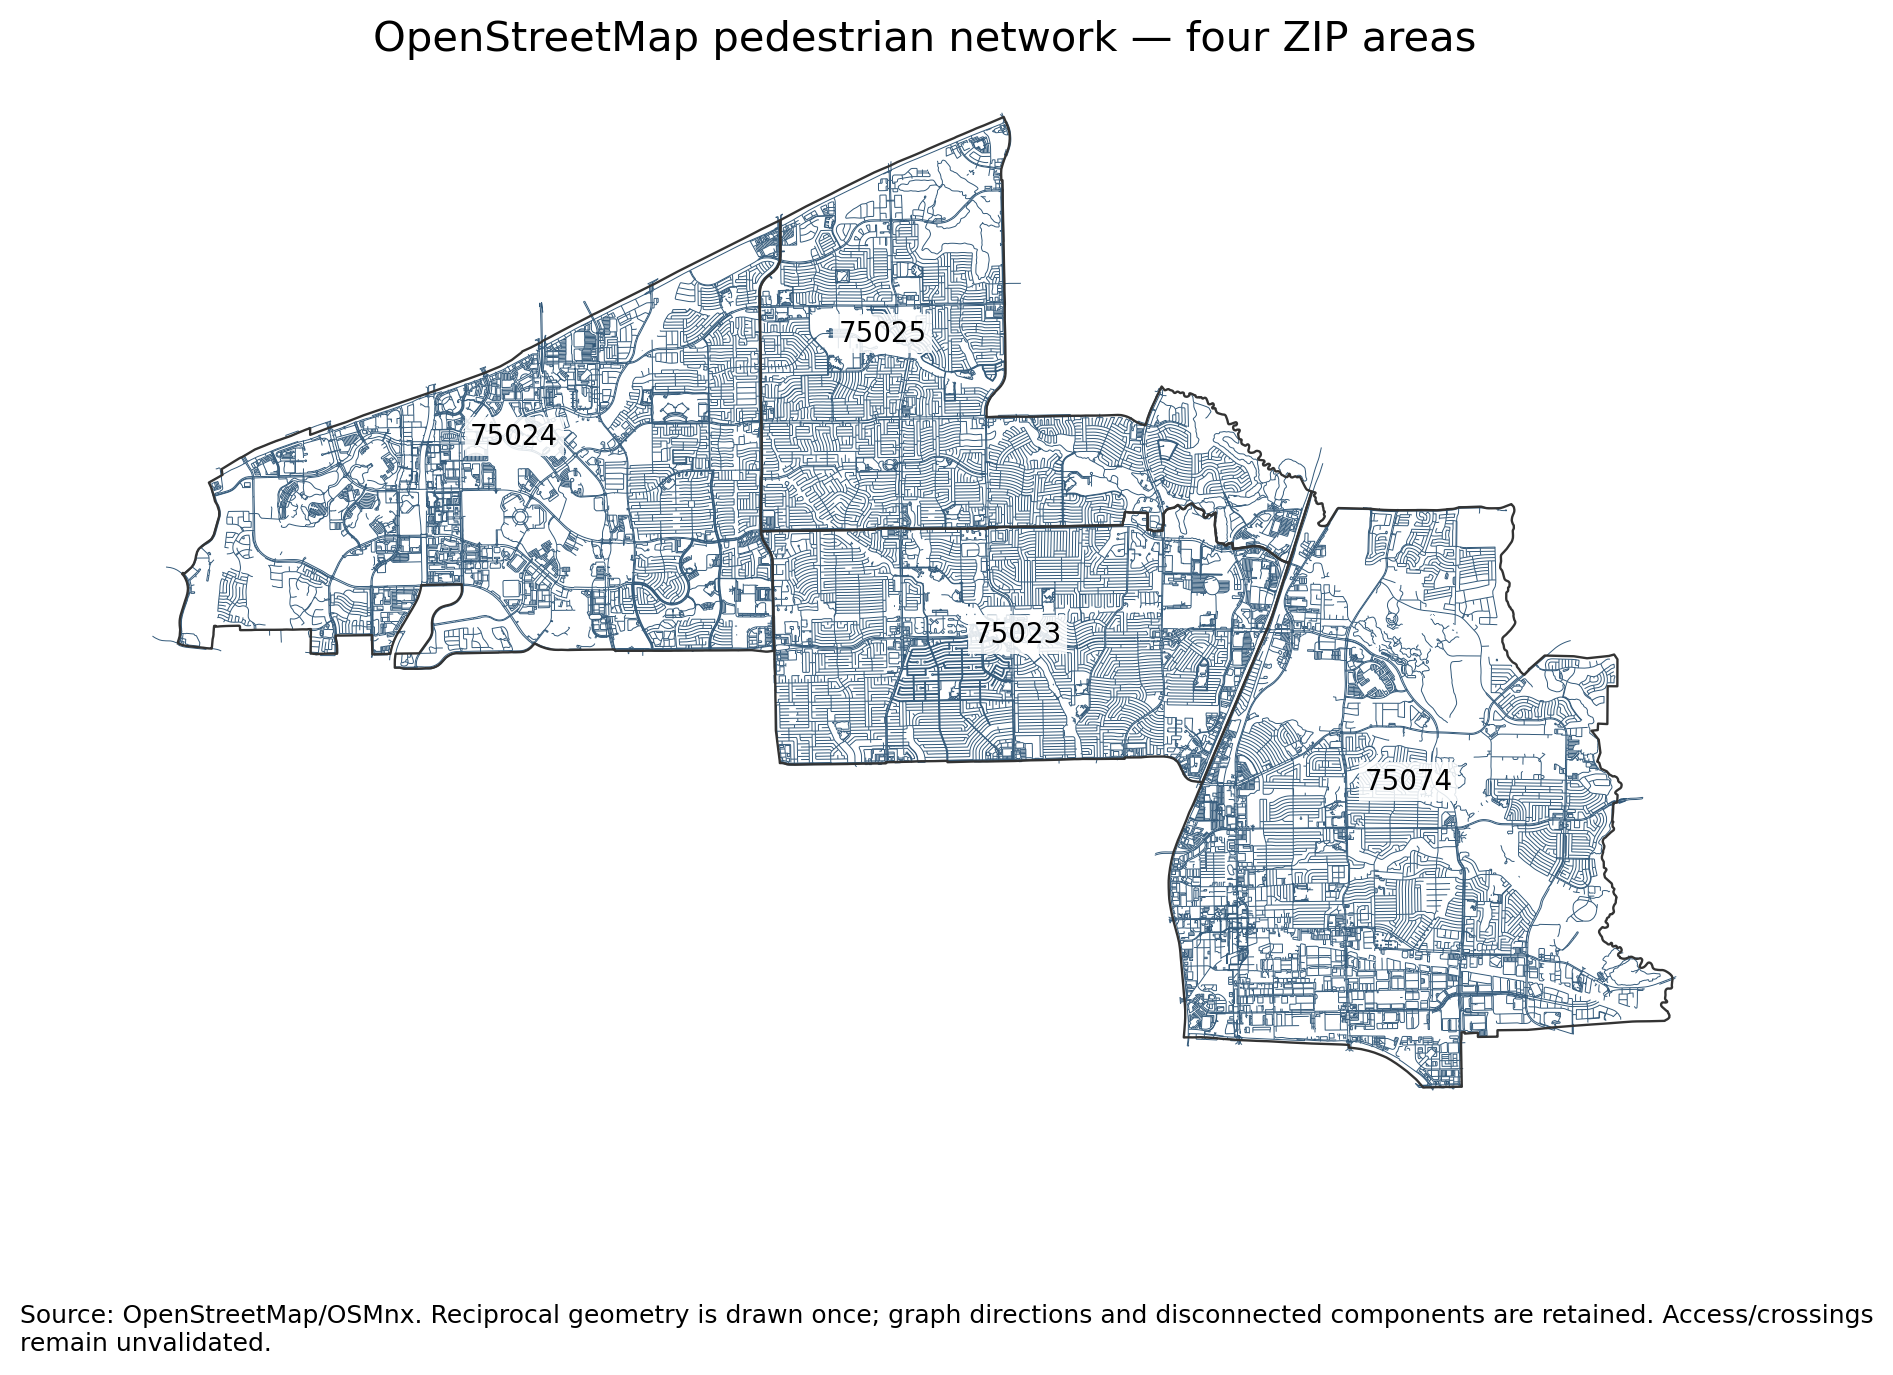
06 walking network
Source: OpenStreetMap/OSMnx. Reciprocal geometry is drawn once; graph directions and disconnected components are retained. Access/crossings remain unvalidated.Download PNG
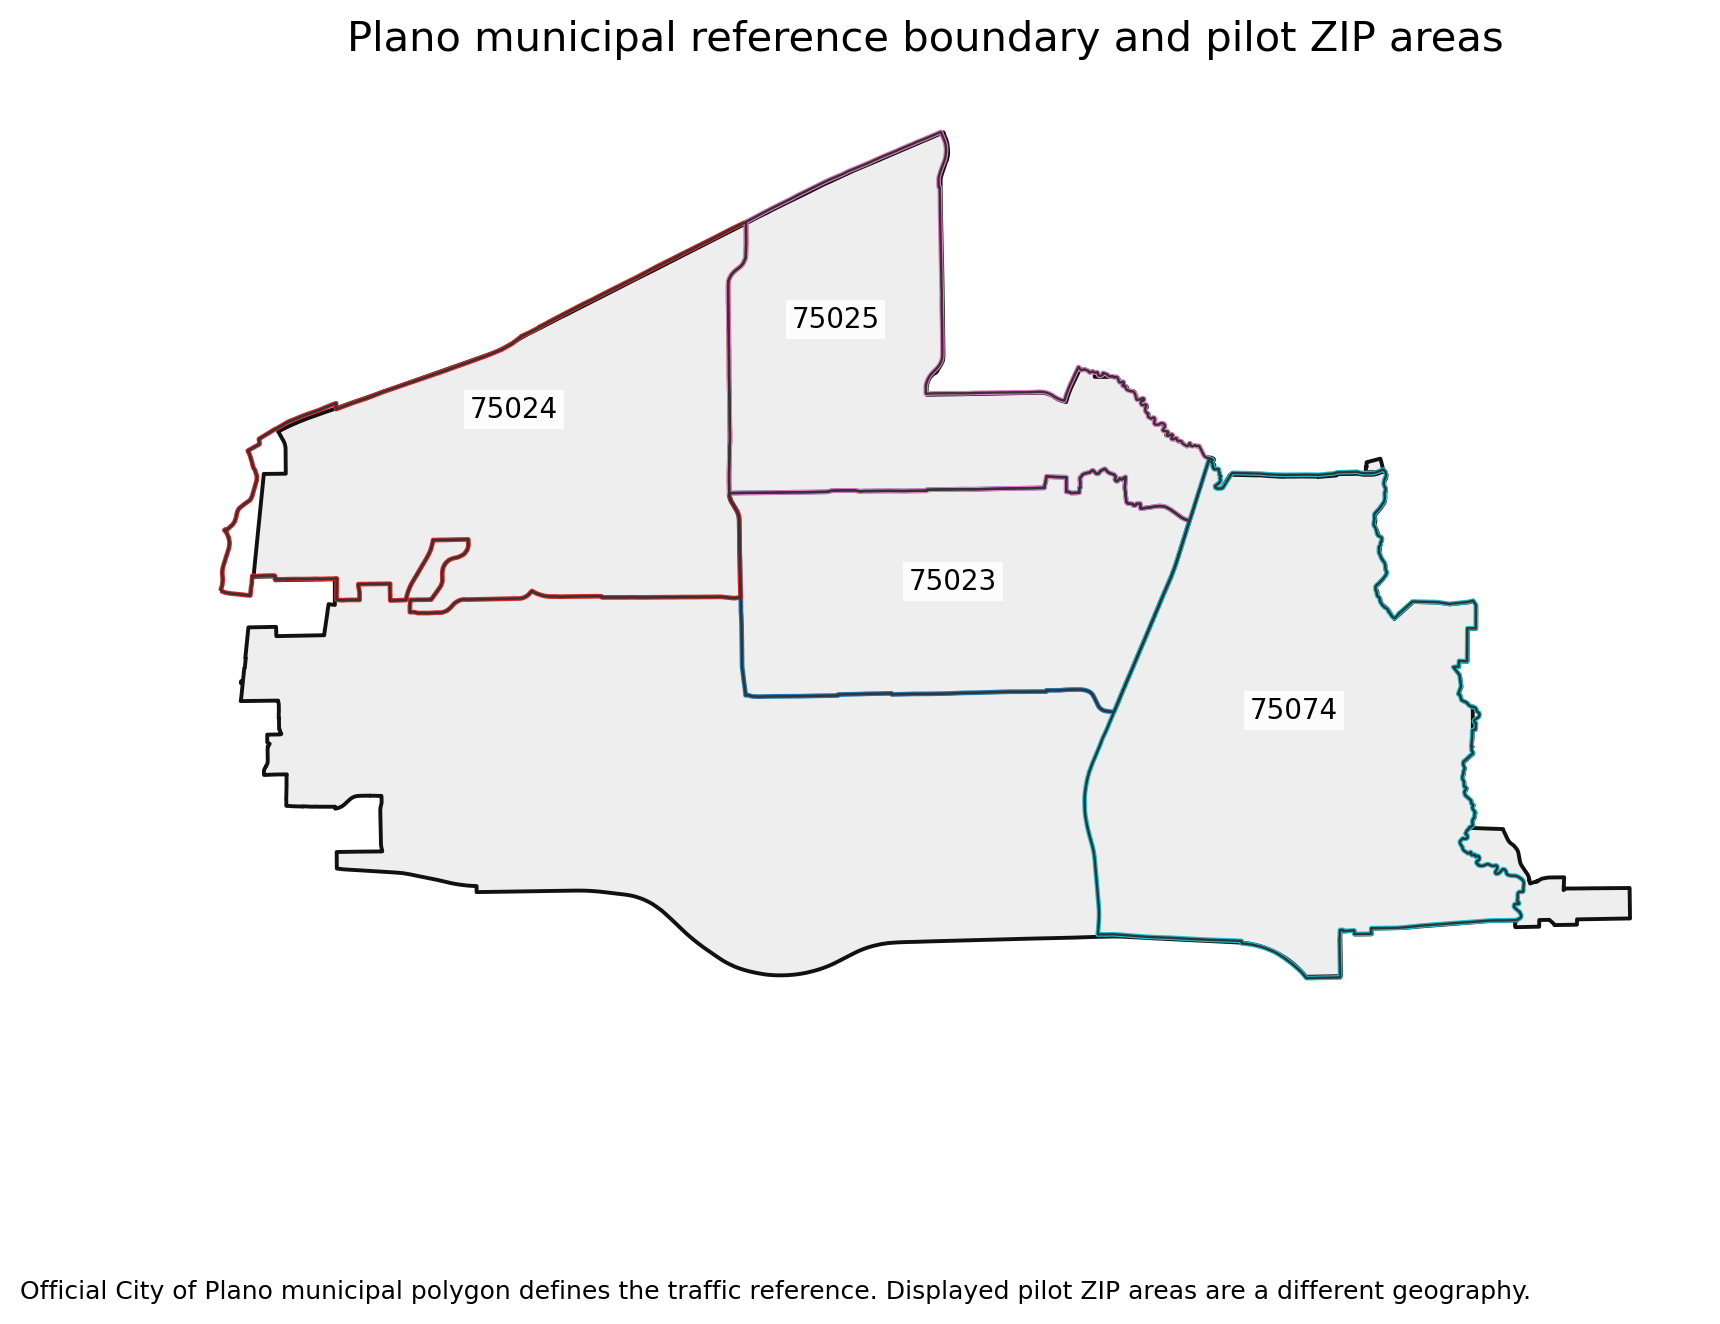
07 plano reference boundary
Official City of Plano municipal polygon defines the traffic reference. Displayed pilot ZIP areas are a different geography.Download PNG
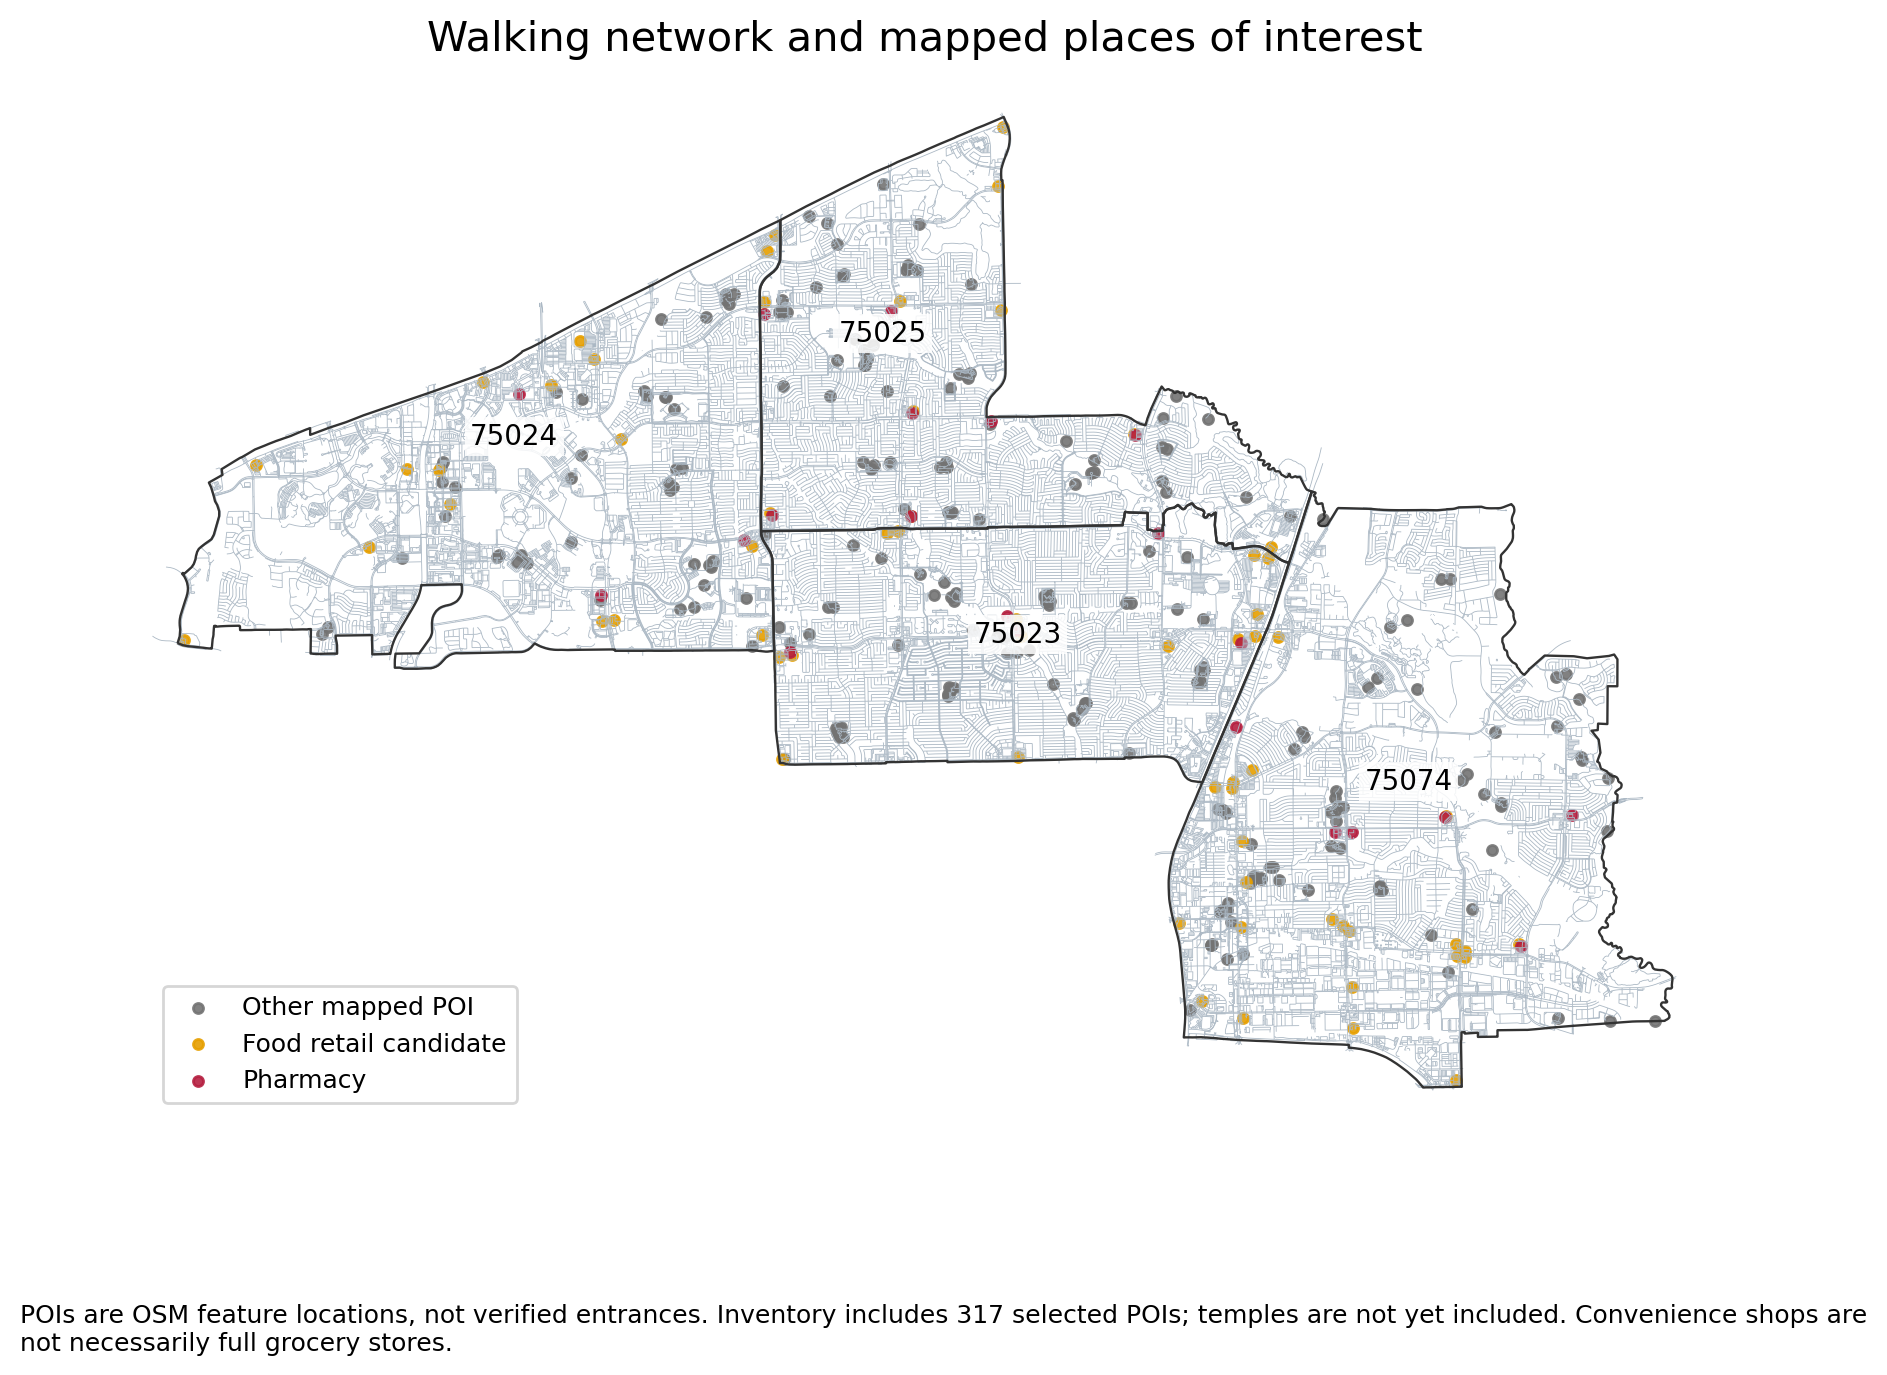
08 network and pois
POIs are OSM feature locations, not verified entrances. Inventory includes 317 selected POIs; temples are not yet included. Convenience shops are not necessarily full grocery stores.Download PNG
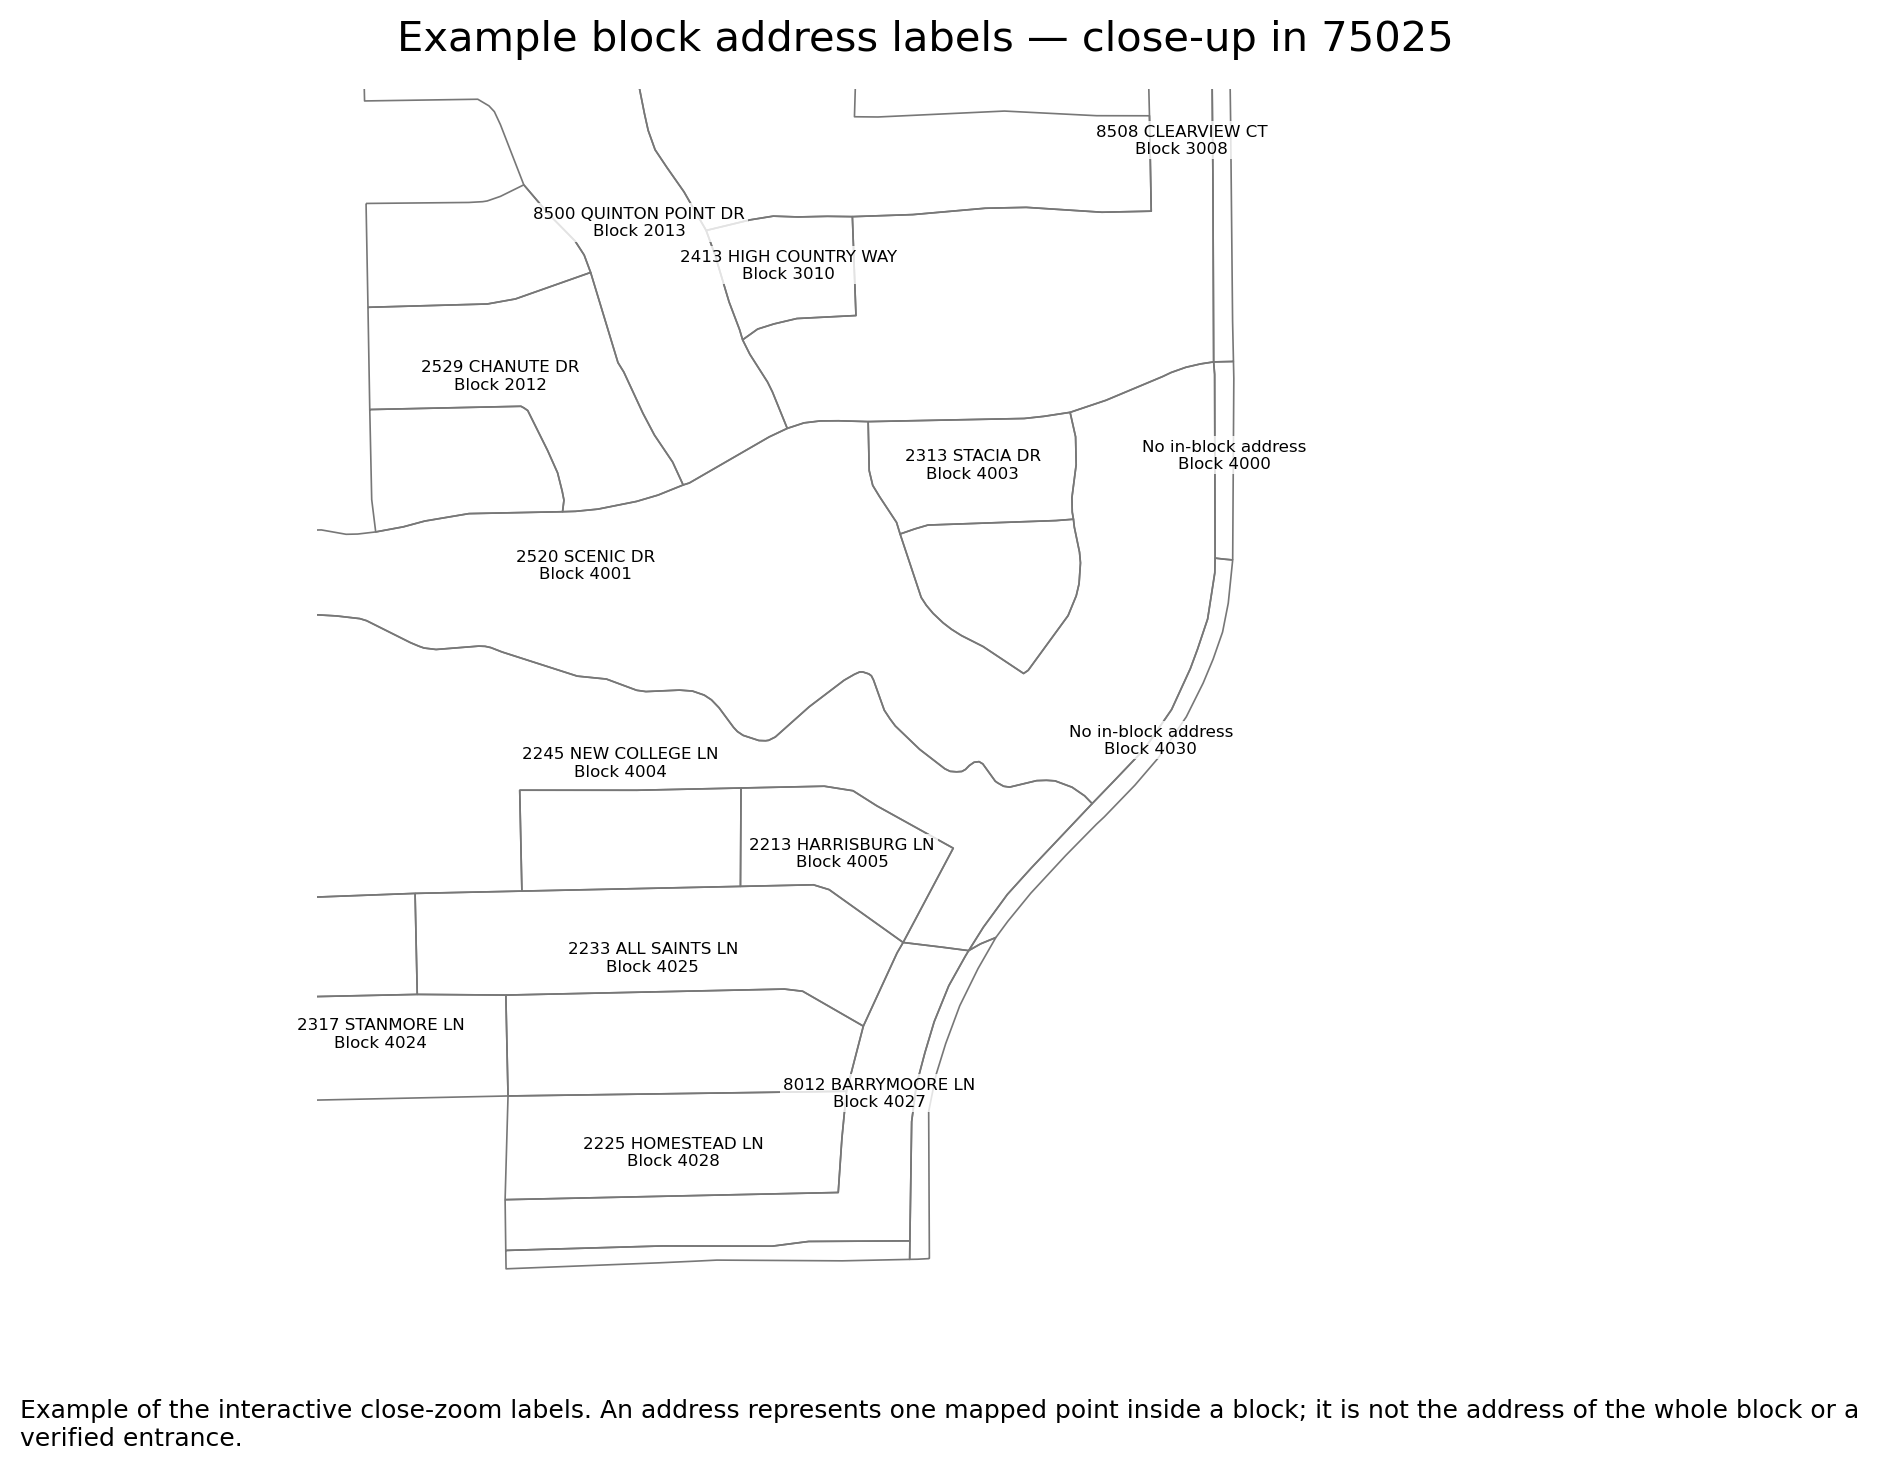
09 block address detail
Example of the interactive close-zoom labels. An address represents one mapped point inside a block; it is not the address of the whole block or a verified entrance.Download PNG
50% canopy deficit + 50% traffic; assumed weights. Gray = missing. Not a learned or validated personal comfort score. Regional weather is shared context.Download PNG
GeoAI explained — one example per ZIP
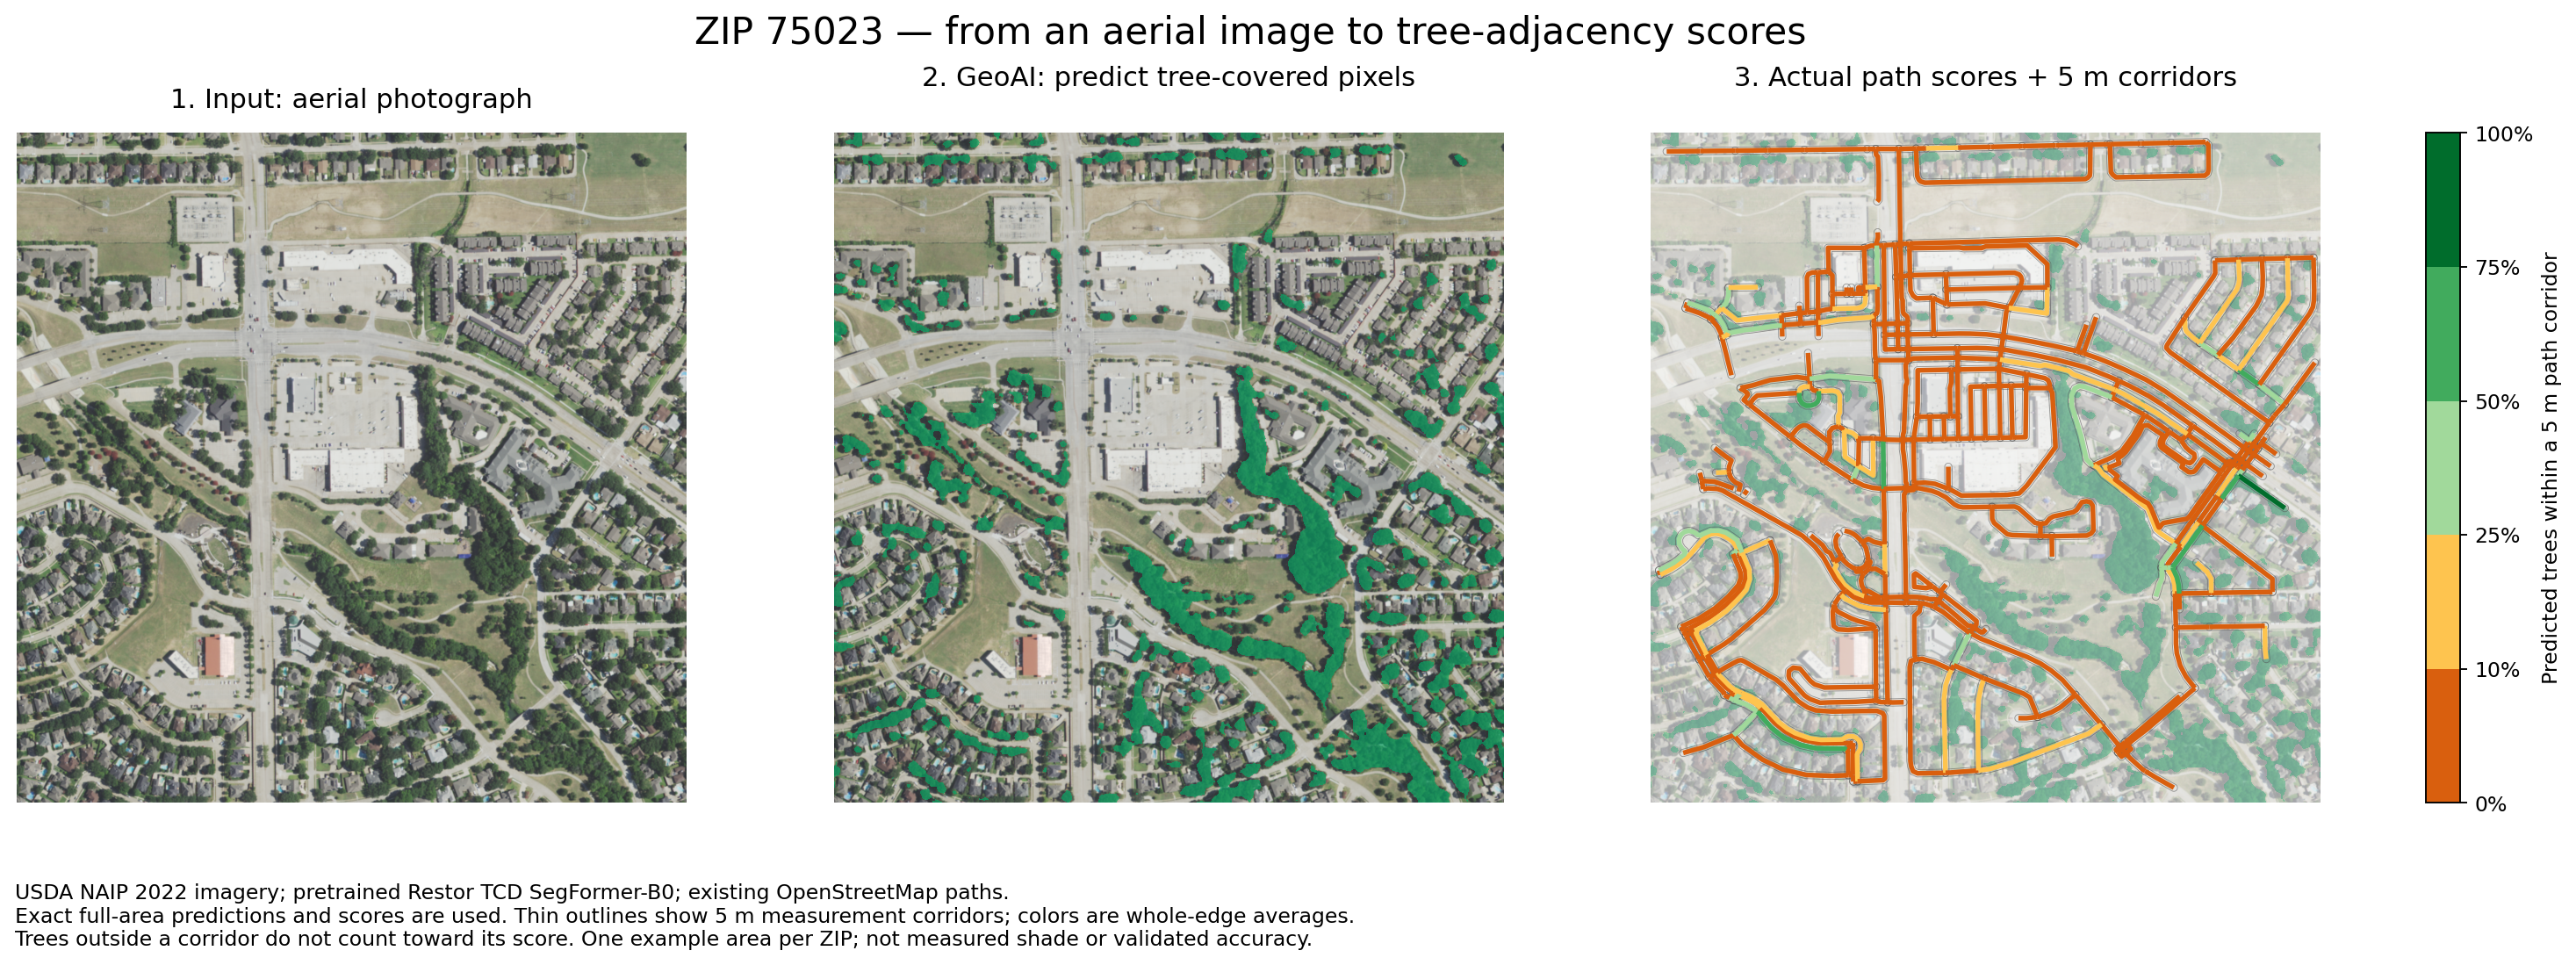
75023: aerial image → AI tree prediction → path score
Uses the same full-area tree predictions and path scores as the live map. Thin outlines show 5 m corridors. Complete edges only; colors are whole-edge averages, not shade predictions.Download PNG
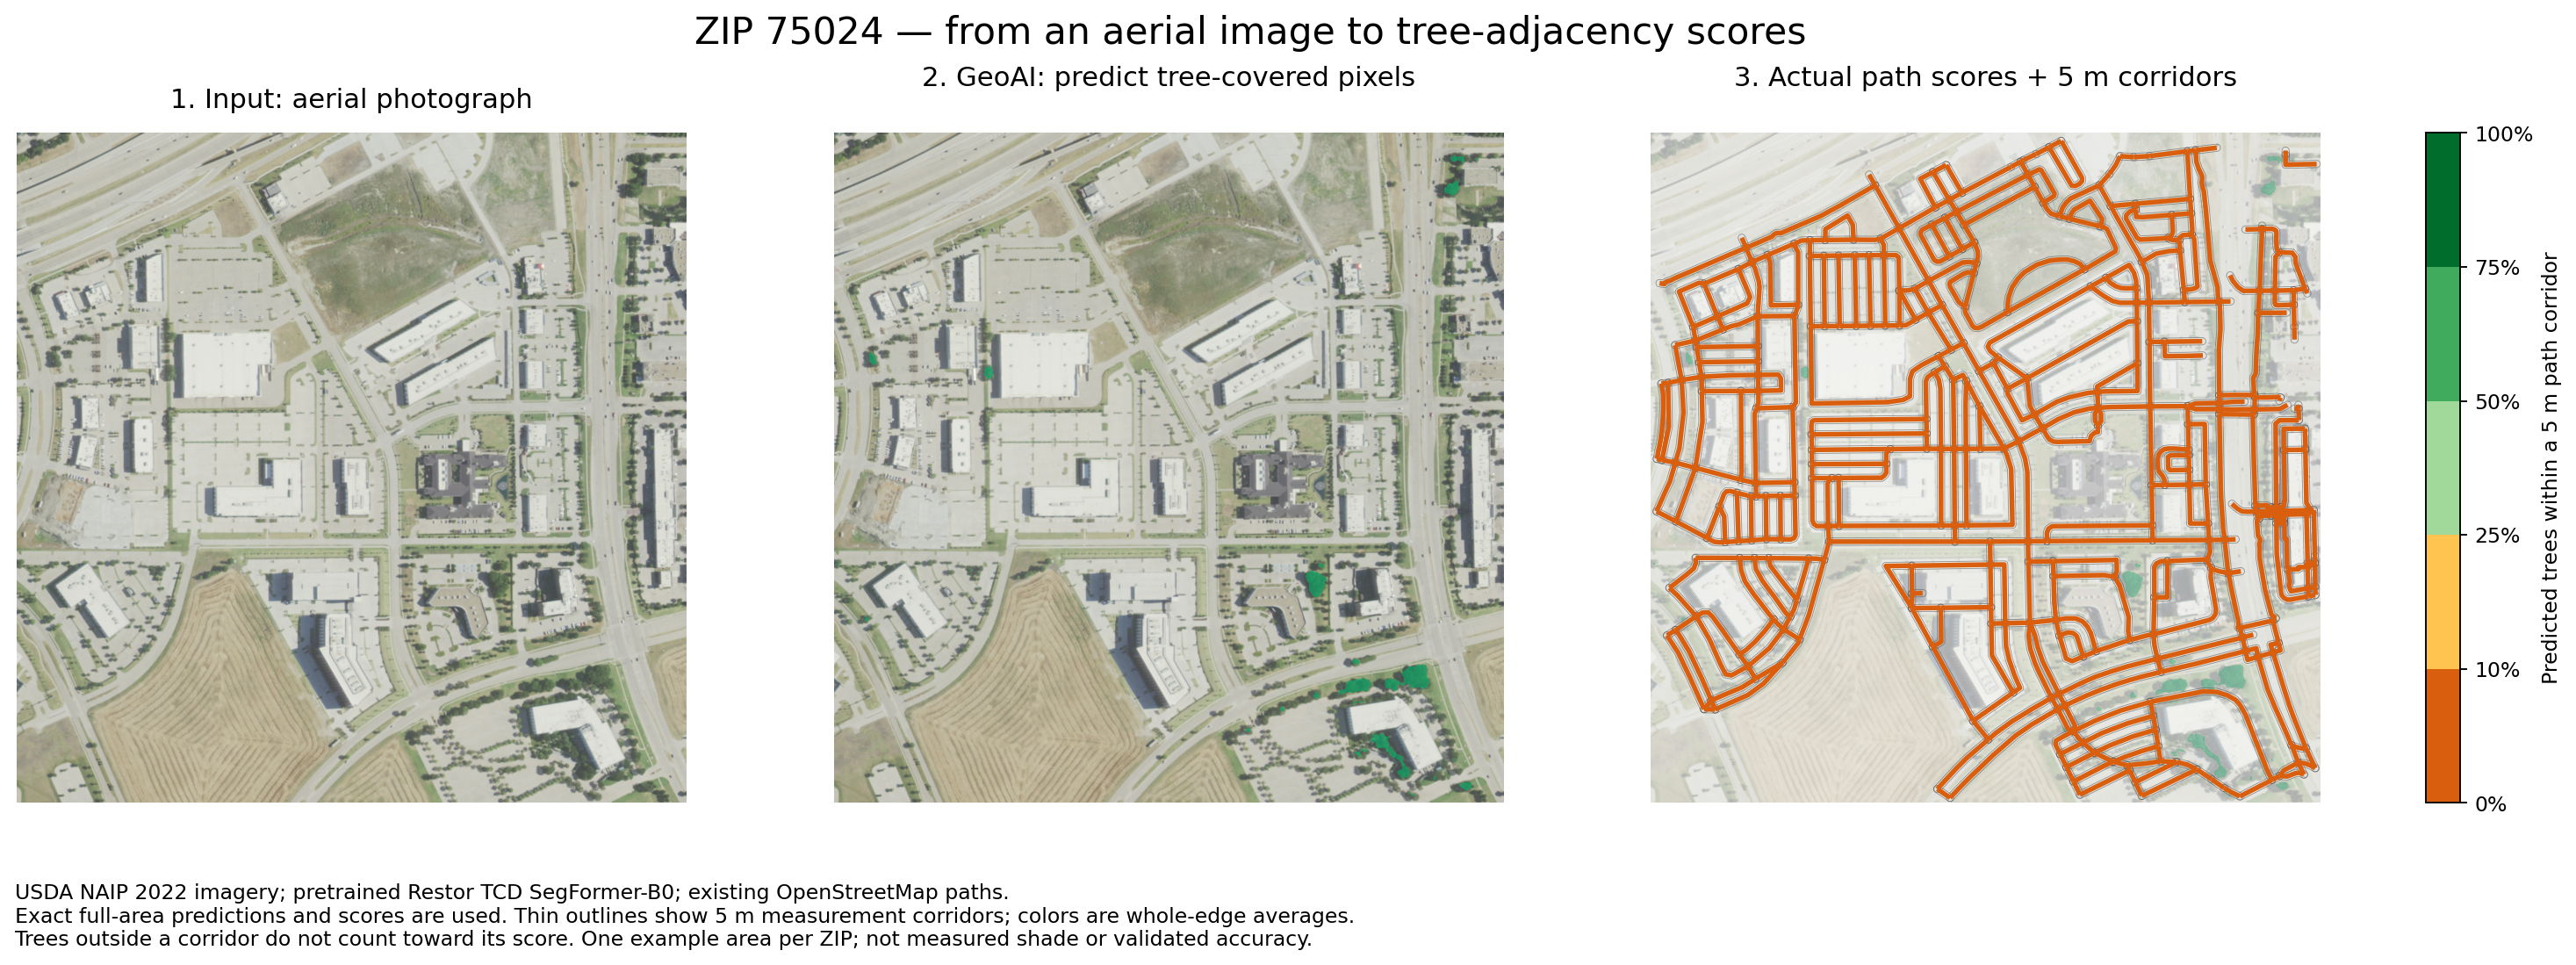
75024: aerial image → AI tree prediction → path score
Uses the same full-area tree predictions and path scores as the live map. Thin outlines show 5 m corridors. Complete edges only; colors are whole-edge averages, not shade predictions.Download PNG
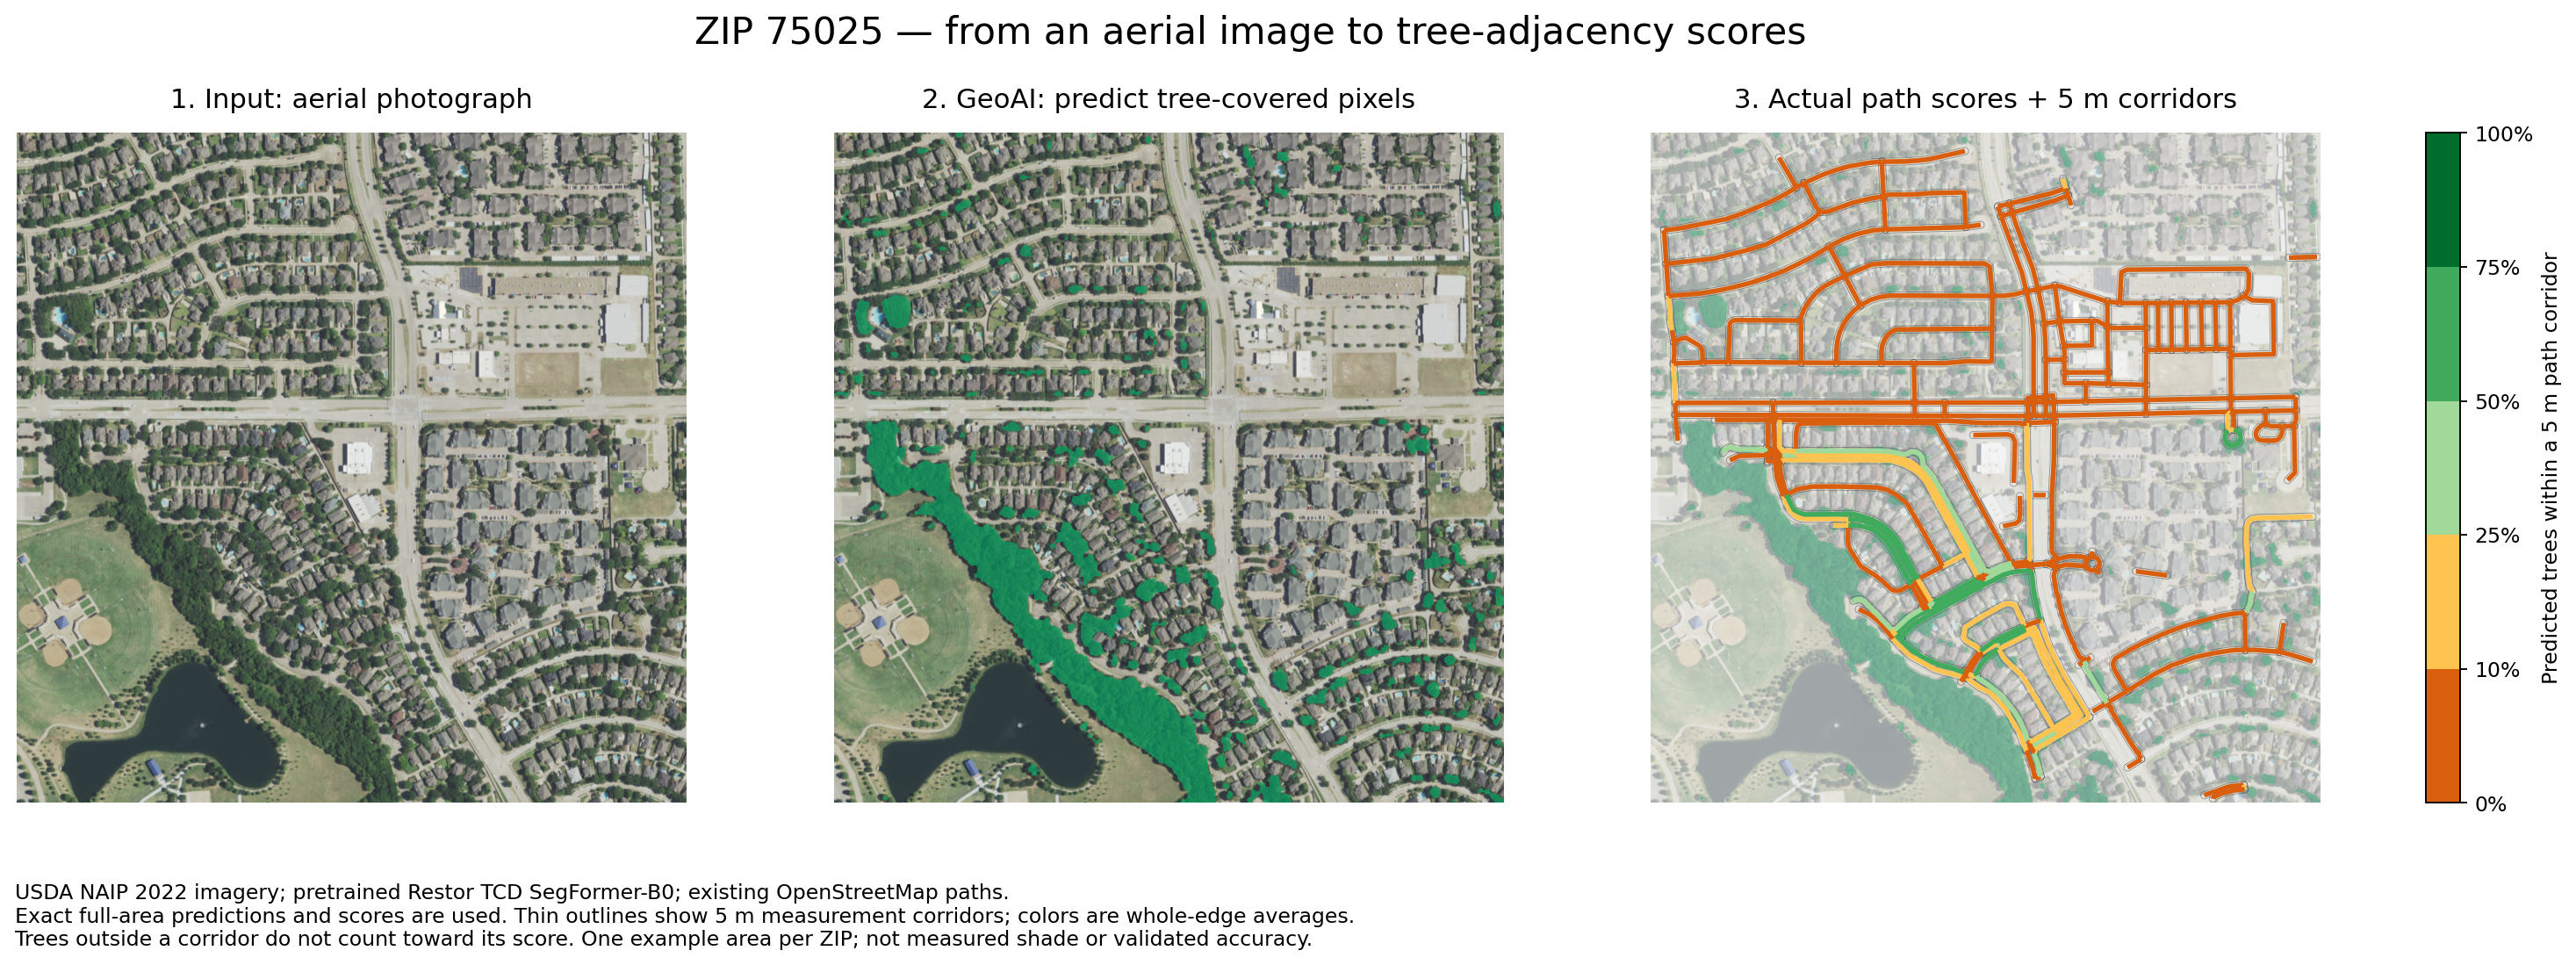
75025: aerial image → AI tree prediction → path score
Uses the same full-area tree predictions and path scores as the live map. Thin outlines show 5 m corridors. Complete edges only; colors are whole-edge averages, not shade predictions.Download PNG
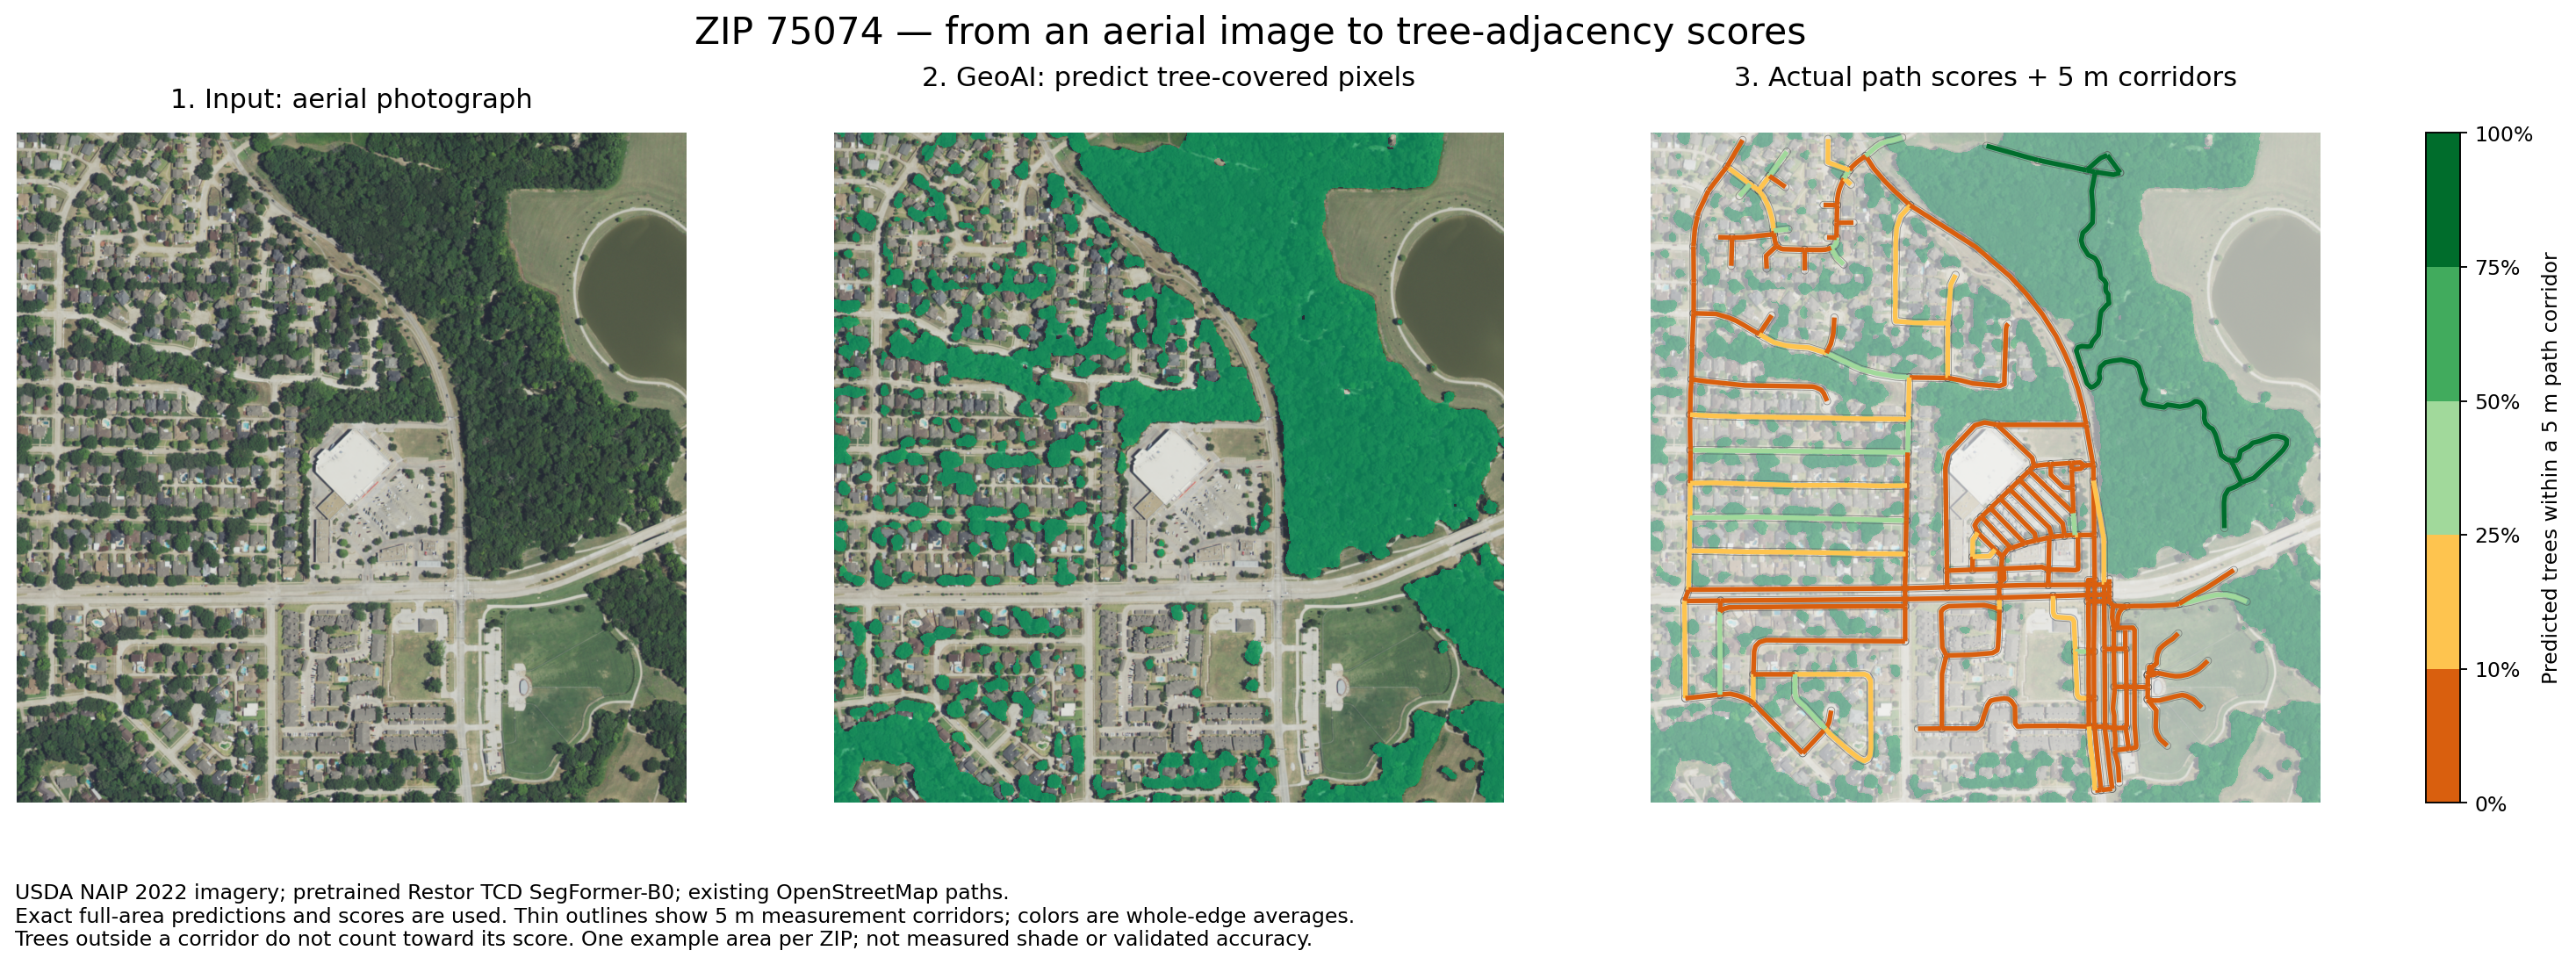
75074: aerial image → AI tree prediction → path score
Uses the same full-area tree predictions and path scores as the live map. Thin outlines show 5 m corridors. Complete edges only; colors are whole-edge averages, not shade predictions.Download PNG